Exploits for the notorious Meltdown and Spectre vulnerabilities may still just be working proofs of concept (PoC) or reportedly experimented on for now, but it's only a matter of time before threat actors fully weaponize them. Meltdown and Spectre are pervasive, affecting machines built as early as 1995. They can also be an especially thorny issue for enterprises under the purview of the EU General Data Protection Regulation (GDPR), for instance.
Apart from patching or updating the systems, it’s also important for organizations to establish more proactive strategies in hunting, detecting, and responding to threats, especially for those as rife as Meltdown and Spectre.
We worked on a detection technique for attacks that exploit Meltdown and Spectre by utilizing performance counters available in Intel processors. They measure cache misses — the state where data that an application requests for processing is not found in the cache memory — that can be used to detect attacks that exploit Meltdown and Spectre.
The attacks that this method identifies exploit the design of modern CPUs where, for efficiency reasons, instructions are executed speculatively to avoid situations where the CPU has to wait and do nothing.
We hope this can complement how system administrators and information security professionals implement their patching strategies. It can also serve as an alternative mitigation method, particularly for systems whose patches may cause stability or performance issues.
Note that detection for MeltdownPrime and SpectrePrime can be based on the discovery of cache-side channel attacks. While parameters can vary, this technique can detect Flush + Reload and Prime and Probe. However, the method is based on Linux; we haven't tested the PoC on Mac systems.
Spectre SGX’s (SgxPectre) purpose is to leak information from secure enclaves. The performance counters might be suppressed inside SGX enclaves, as documented in Intel’s SGX programming reference. However, because the cache timing attack is performed outside the SGX enclave in untrusted code, the performance counters will contain information on cache hits and misses. Detection is still possible but we cannot fully ascertain as we have not fully tested this. The parameters (i.e., sampling, threshold) vary and depend on the environment.
How Meltdown and Spectre’s Speculative Execution is Exploited
Meltdown is a vulnerability where a CPU speculatively executes instructions that access memory without proper access rights in a way that a cache side-channel attack can retrieve actual value. The CPU then realizes that the user has no access rights and discards the result. However, footprints remain in last-level cache (LLC), allowing the attacker to retrieve the memory value.
Let’s take the syntax/instruction below as example:
mov rax, [forbiddenAddress]
…
In this scenario, accessing the “forbidden” memory raises a page fault, resulting in a SIGSEGV error signal that terminates the process by default. However, an attacker can register his custom handler for Segmentation Violation (SIGSEGV) signals, allowing him to read a memory block without crashing the main application.
These signals leave footprints inside the operating system (OS). These footprints can be eliminated by using Intel’s Transactional Synchronization Extensions (TSX), which allows the processor to determine if threads need to be serialized. Basically, an attacker abuses the Restrictid Transactional Memory (RTM) interface. A Meltdown attack code, as shown below, is wrapped by the xbegin, xend instruction, which will suppress the exception signal (no page fault raised). In fact, it exploits Meltdown faster with less noise:
xbegin
mov rax, [forbiddenAddress]
…
xend
Spectre is a vulnerability that also takes advantage of speculative instruction execution. Unlike Meltdown though, Spectre reads the forbidden memory inside a conditional branch. Note that this branch should not be taken. However, modern CPUs use branch predictors to calculate which branch to use then speculatively execute instructions inside this branch.
In a very simplified form this is how a Spectre attack would look like:
…
mov rax, [rbp-10] // rax eq. 5
mov rbx, [rbp-18] // rbx eq. 4>
xor rax, rbx
je no_way
…
ret
no_way:
mov rax, [forbiddenAddress]
The goal of the attacker is to “train” the branch predictor to get the result of instruction responsible for conditional branch decisions (in this case, XOR) wrong so the no_way statement is speculatively executed. The CPU realizes this misprediction and then discards the execution. However, an attacker can probe the cache to retrieve the value. This scenario is handled inside a CPU, so no page fault is generated.
Similar to the previous case, the attacker is now able to obtain the value using cache side-channel attacks. No exception is passed to the OS in this scenario. Note that Spectre is harder to exploit and is more dependent on the CPU used due to differences in branch predictors.
Using Cache Misses to Detect Meltdown and Spectre Attacks
As Meltdown can leave footprints due to page_fault, we can detect attacks that exploit it simply by capturing signals using kernel tracing. This mechanism captures SIGSEGV signals (segfaults) inside the OS. If one process is generating too much segfaults, then an alarm is triggered.
We tested this approach using the Linux kprobe tool catching the force_sig_info event. We can confirm that we were able to detect Meltdown attacks using a custom signal handler. The false positive ratio is low in this case, as cases of too many SIGSEGV signals for one process are very specific and suspicious. However, if the attacker uses TSX instructions and SIGSEV is not thrown, this detection method won’t trigger the alarm.
Meltdown and Spectre both use cache side-channel attacks to retrieve actual values, which is possible because of the micro-architectural design of CPUs. But can they be detected? Caches are used to reduce latency for memory loads. Modern CPUs use a multilevel cache structure starting from the L1 cache, which is the fastest, to L3, which is the slowest. The cache is inclusive, meaning that Li⊂Li+1.
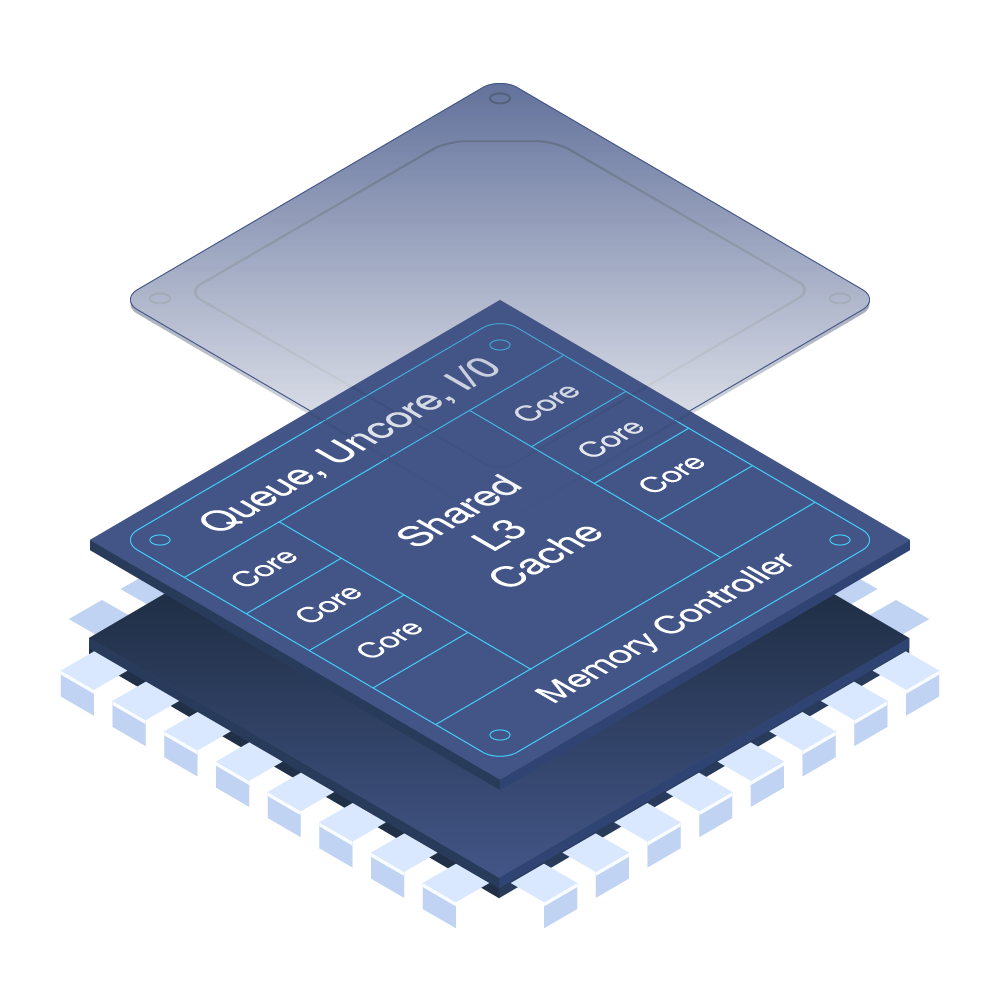
Also, the L3 cache is shared among the cores and contains both data and instructions, which together make it susceptible to an attack. The L3 cache is the last cache before the dynamic random-access memory (DRAM) and provides mapping to the DRAM.
 Figure 1. Components of a modern CPU, showing the cores and L3 cache
When obtaining a value from memory that is also in the cache (cache hit), the access time is much faster than when you need to load it from DRAM (cache miss). It is possible for an attacker to distinguish between a cache hit and a cache miss. This is the principle used for transmitting information in these types of attacks. Logically, there will be an increased number of cache misses during an attack. But can cache misses be measured and used for detecting attacks? How can malicious and benign behaviors be distinguished to avoid false positives (FPs)?
Cache misses can be measured through hardware performance counters. There are actually two types of performance counters/performance counter monitor (PCM) available in Intel processors: architectural, and model-specific PCMs. Architectural performance counters behave consistently across microarchitectures, and they have been introduced in Intel Core Solo and Intel Core Duo processors.
Architectural PCM can be easily checked by executing the cpuid instruction (eax=0x7, ecx=0x0), which provides information about the availability of these counters. In our tests, the output below was taken from intel_cpu_info utlity running with -arch argument:
Printing architectural CPU Information:
Version ID of architectural performance monitoring = 4
Number of general-purpose performance monitoring counter per logical processor = 4
Bit width of general-purpose, performance monitoring counter = 48
Length of EBX bit vector to enumerate architectural performance monitoring events = 7
Core cycle event available: yes
Instruction retired event available: yes
Reference cycles event available: yes
Last-level cache reference event available: yes
Last-level cache misses event available: yes
Branch instruction retired event available: yes
Branch mispredict retired event available: yes
Number of fixed-function performance counters ((if Version ID > 1) = 3
Bit width of fixed-function performance counters (if Version ID > 1) = 48
For counters related to LLC, note the LLC references and LLC misses events. Intel defines them as:
- Last Level Cache References – Event select 2EH, Umask 4FH. This event counts requests originating from the core that references a cache line in the last level cache.
- Last Level Cache Misses – Event select 2EH, Umask 41H. This event counts each cache miss condition for references to the last level cache.
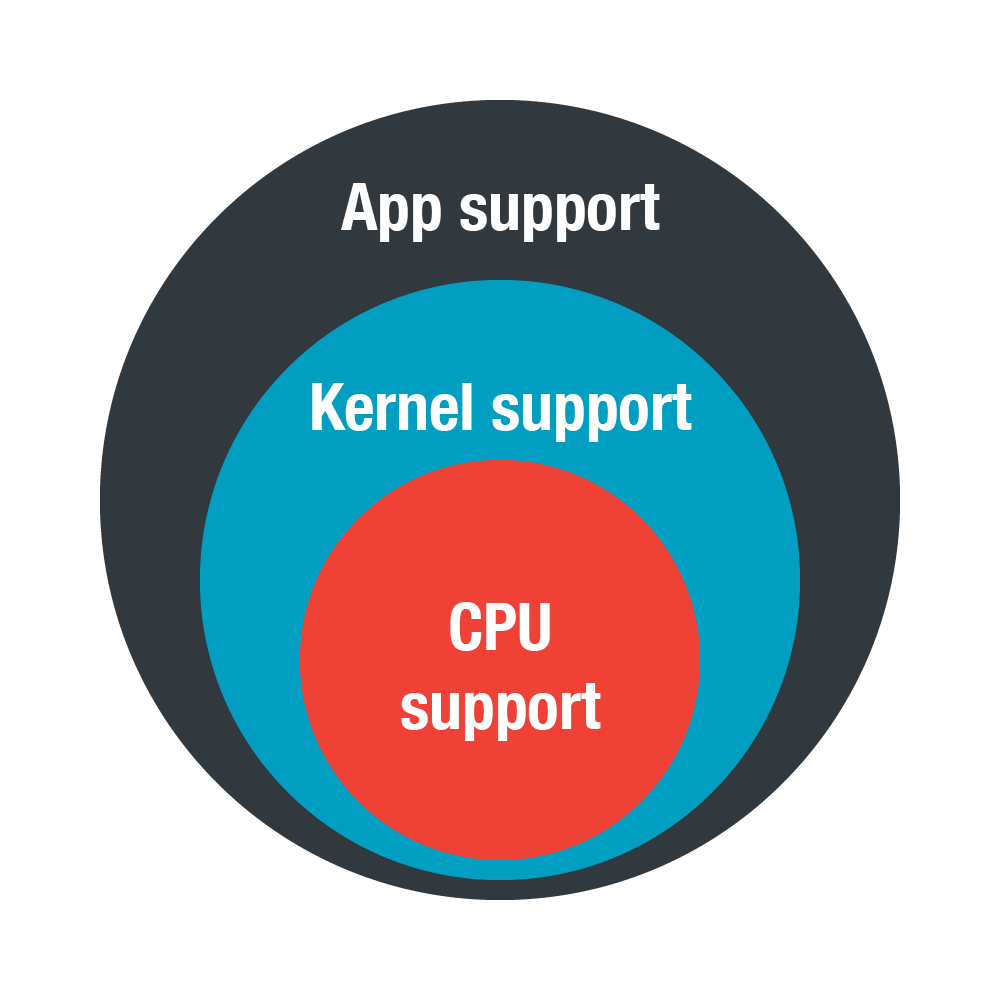
Determining the availability of PCMs is required when measuring cache misses, especially in virtual environments. CPU and kernel support are also needed to obtain these values as the instruction for reading them can’t be executed from usermode. An application is necessary for getting these values from the kernel.
 Figure 2. Components needed to determine the availability of PCMs
Performance-analyzing utilities (perf tools) solve this problem in Linux environments. Other platforms will most likely need a special driver.
Executing the perf list command will list available events. The Last-level cache references and Last-level cache misses are aliased as cache-misses and cache-references, respectively. Obtaining LLC references and LLC misses can also be done by using raw access as specified by Intel via the command perf stat -e r4f2e,r412e.
The other option can be LLC-loads and LLC-load-misses counters as they are both related to LLC. However, note that these counters are model-specific and unavailable in some environments. For example, obtaining LLC-load-misses is unfeasible on physical machines running on Sandy Bridge microarchitecture, but LLC-loads are obtainable.
 Figure 3. Limited counter access on physical machine
These counters also cannot be obtained in virtual machines running on VMware, even when Virtual CPU Performance Monitoring Counters is enabled. However, LLC References and LLC-miss events can still be acquired.
 Figure 4. LLC References and LLC Misses raw access
We recommend testing the availability of these counters via the perf stat command. We used LLC references, LLC misses and LLC-loads, LLC-load-misses counters in environments where they were available. We also tested their availability inside Linux VMs created in popular cloud solutions, but the counters were unavailable or unsupported.
Detection Testing
To verify if cache misses can indeed be used as a detection mechanism for side-channel attacks, we used LLC-related performance counters using the following settings:
- We set two perf events (LLC-references and LLC-misses) for each logical CPU and measured all processes/threads on each CPU. Counter values were read after overflowing sampling period P. Then we computed LLC miss rate as:

- We triggered detection when an MR > 0.99.
- We tested two sampling periods P1=10 000, P2=20 000.
We tested the following test scenarios for using physical machines:
- Stress commands running 2m each (where # is the number of logical CPUs)
- stress -c #
- stress -i #
- stress -m #
- stress -d #
- stress -c #
- stress -c # -i # -d #
- stress -c # -I # -d # -m #
- 4k video playback using VLC
- Deploy Meltdown PoC exploit
- Deploy Spectre PoC exploit
We obtained the following results for described scenarios for LLC-references and LLC-misses events: Physical Machine 1 Sampling P1=10,000
- Stress commands triggered FPs only when -m parameter was involved
- 4k video playback triggered FPs
- Meltdown PoC was successfully detected
- Spectre PoC was successfully detected
Sampling P2=20,000
- Stress commands triggered FPs only when -m parameter was involved
- 4k video playback did not trigger any FP
- Meltdown PoC was successfully detected
- Spectre PoC was successfully detected
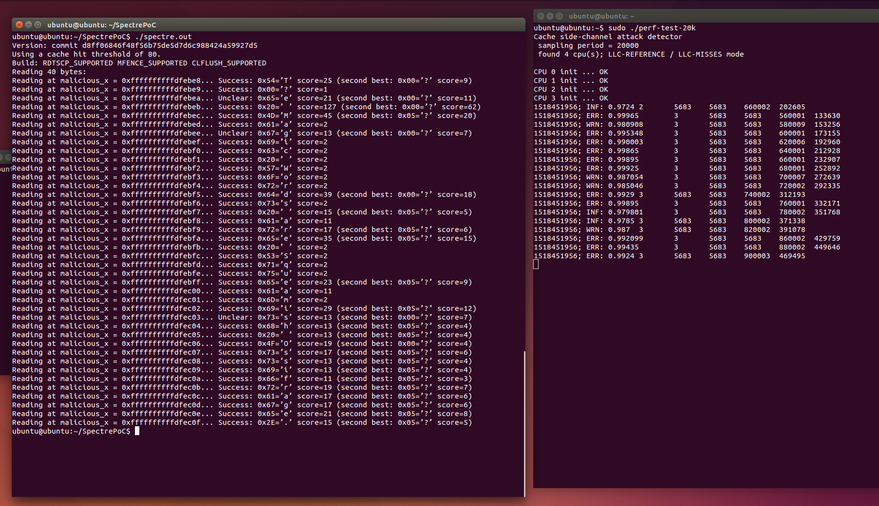
 Figure 5. Example of Spectre PoC detection using PCM
Physical Machine 2:
Sampling P1=10,000
- Stress commands triggered FPs only when -m parameter was involved
- FPs occurred during 4k video playback
- We were able to detect Meltdown PoC
- We were able to detect Spectre PoC
Sampling P2=20,000
- Stress commands triggered FPs only when -m parameter was involved
- No FPs during 4k video playback
- We were able to detect Meltdown PoC
- We were able to detect Spectre PoC
Virtual Machine 1:
Sampling P1=10,000
- Stress commands triggered FPs only when -m parameter was involved
- N/A
- We were able to detect Meltdown PoC
- We were able to detect Spectre PoC
Sampling P2=20,000
- Stress commands triggered FPs only when -m parameter was involved
- N/A
- We were able to detect Meltdown PoC
- We were not able to detect Spectre PoC
For LLC-loads and LLC-load-misses events:
Physical Machine 1 - counters are unavailable on this machine.
Physical Machine 2
Sampling P1=10,000
- Stress commands triggered FPs only when -m parameter was involved
- No FPs during 4k video playback
- Meltdown PoC detected
- Spectre PoC detected
Sampling P2=20,000
- Stress commands triggered FPs only when -m parameter was involved
- No FPs during 4k video playback
- Meltdown PoC detected
- Spectre PoC detected
Virtual Machine 1 - counters are unavailable on this machine.
The environments in our tests were:
- Physical Machine 1: Core i5-2430M @2.40GHz, Sandy Bridge, Ubuntu 14.04
- Physical Machine 2: Core i7-4600U @2.10GHz, Haswell, Ubuntu 14.04
- Virtual Machine 1: VMware ESX VM running on Intel Xeon E5-2660 @2.2GHz, Sandy Bridge, Ubuntu 16.04
vpmc.enable = "TRUE"
vpmc.freezeMode = "vcpu"
False Positives
We observed that the sampling period influences the occurrence of FPs. The FPs remained when a stress -m command was running. Following the documentation of stress we can see that:
-m, --vm N
spawn N workers spinning on malloc()/free()
This is not surprising as we previously mentioned that LLC has a relationship to physical memory. As a result, we suggest being more careful in environments where frequent memory allocations take place.
Based on our observations, LLC-loads and LLC-load-misses are more precise counters. However LLC references (cache-references) and LLC misses (cache-misses) can be used as well.
| Detection Technique | Exception Mitigation | Protection | False Positive | Is virtual environment attack feasible? |
| PCM | TSX | Protected | High | Yes (if TSX is available inside VM; in our test it was not available to VM) |
| ktrace | TSX | No protection | N/A | Yes (if TSX is available inside VM; in our test it was not available to VM) |
| PCM | Conditional Branch | Protected | High | Yes |
| ktrace | Conditional Branch | No protection | N/A | Yes |
| PCM | None (direct access to memory | Protected | High | Yes |
| ktrace | None (direct access to memory) | Protected | Low | Yes |
Figure 6. Summary of our tests on using ktrace (kernel tracing) and PCM; the side-channel technique for each is Flush-Reload Note: PoCs are available for Spectre and Meltdown using “Conditional Branch” to avoid exceptions. ktrace cannot protect or detect the attack in this case.
There is No Silver Bullet
Detection based on kernel tracing and SIGSEV signals protects against attacks that exploit Meltdown in environments where TSX-NI instruction set extension is not available, which is dependent on the machine CPU (i.e., Intel microprocessors based on the Haswell microarchitecture).
There are available tools for properly checking Intel TSX-NI’s availability. There’s one that uses cupid instructions; follow Intel’s 64 and IA-32 Architectures Software Developers Manual for checking.
Generic detection of cache side-channel attacks using CPU performance counters can be used in environments where they’re available. Their availability can be checked by running perf stat -e -a cache-references,cache-misses,LLC-loads,LLC-load-misses on Linux with perf-tools installed. The hardware performance counters are not available in most virtual environments by default (Amazon AWS, Azure, Virtual Box). This can be enabled on VMware though.
Accessing the performance counters on other platforms such as Windows and macOS will require more effort as these counters are not accessible from usermode. This requires a proper kernel driver for reading counter values, sampling or even getting the process ID (PID) responsible for increased cache misses.
We also suggest tuning the detection parameters against the running environment. We also keep the decision based on alarm, depending on the user. This approach provides PID and task ID (TID) so the user can act on a flagged process or thread.
The sampling period also influences sensibility: Higher sampling leads in less FPs, but an attack can remain undetected if the hacker times it properly. This entails reading a small number of bytes and then sleeping for a period of time. This approach will slow down the attack, as reading a bigger block of memory in a row triggers the alarm. On the other hand, a small sampling will lead to multiple false positives. We observed that performance counters inside VMware are less sensible than on physical machines.
We verified that this type of detection can be used for FLUSH+RELOAD cache side-channel attacks if hardware counters are available. However, it should be tested and tuned for a running environment.
Indeed, there’s no one-size-fits-all solution for detecting and thwarting attacks that exploit Meltdown and Spectre. Mitigations factor in different parameters, for instance, while detection mechanisms depend on the availability of components in a specific environment.
Awareness and actively detecting ever-evolving threats is important, but so is defense in depth. A proactive incident response strategy also helps provide visibility into a threat’s kill chain so organizations can better remediate them, especially attacks that employ vectors as ubiquitous as Meltdown and Spectre.

