TrendAI™ 2026 Cyber Risk Report
TrendAI™ 2026
CYBER RISK REPORT
The 2026 Cyber Risk Report builds on last year's findings with expanded telemetry, providing organizations with the directional insights and data that can be used to help prioritize the exposures that matter most before attackers reach them.
TrendAI™ Research tracks risk insights across enterprise environments globally to help organizations stay ahead of an evolving threat landscape. The 2026 Cyber Risk Report draws primarily on 2025 telemetry from the TrendAI Vision One™ Cyber Risk Exposure Management (CREM) solution, XDR capabilities, and global threat intelligence infrastructure, supplemented by the latest available datasets where full-year coverage did not yet exist.
At the center of CREM is the Cyber Risk Index (CRI): a metric that quantifies an organization's overall security risk by consolidating individual asset and risk factor scores.
This year's report introduces a new dataset drawn from telemetry from the TrendAI Vision One™ Attack Path Prediction capability, providing a forward-looking complement to the Cyber Risk Index scores and event detections that anchor our annual analysis.
This transitional report builds on the previous Cyber Risk Report. As 2026 telemetry matures, we expect the 2027 report to expand this view with more AI-related risk and threat datasets, building on the baseline risk, detection, vulnerability, and attack-path findings introduced here. Figures in this report reflect observations across our customer base rather than a statistically representative sample of any industry, region, or the threat landscape overall, and are presented as a directional signal. Explanations of why metrics move or differ reflect our analysts' informed judgment rather than statistically tested or causal findings.

Global Cyber Risk Index records second consecutive year of improvement
35.8
Global average Cyber Risk Index, 2025
38.5 → 35.8
Year-over-year CRI improvement 2024 to 2025
100%
Share of organizations in the telemetry still in the medium risk band (31 – 69)
The global average Cyber Risk Index fell from 38.5 in 2024 to 35.8 in 2025, continuing a positive trend. Monthly movement suggests the improvement was not linear: the CRI spiked to 37.4 in April, dropped to a low of 34.1 in July, and settled at 36.7 by year-end. The oscillating pattern contrasts with 2024's steady month-on-month decline and may indicate organizations are managing risk reactively rather than sustaining continuous improvement. Despite the year-over-year gain, every organization in the telemetry still falls within the medium risk band (31 – 69).
| Mining 42.5 CRI | Mining enters the top of the rankings for the first time. Rapid OT digitization across geographically dispersed sites appears to be expanding the attack surface faster than security controls are being established. Unlike every other sector in the top five, email-borne threats lead its risk events—not cloud app access—pointing to targeted phishing as a likely primary initial access vector. Unoptimized Endpoint Sensor Settings suggest mining organizations may be operating with significant detection blind spots. |
| Healthcare 40.3 CRI | Healthcare remains in the top three for the second consecutive year. A large and diverse device estate—much of it running software that cannot be patched without regulatory approval or risk to patient care continuity—keeps its CRI elevated. The 2024 mean time to patch data indicated healthcare was the slowest-patching industry at 41.5 days. Device Control Settings top its misconfiguration list, and Risky Cloud App Access leads its risk events, consistent with rapid adoption of cloud-based clinical tools without corresponding governance frameworks. |
| Agriculture 40.3 CRI | Agriculture is the only sector in the top five whose risk events are dominated by Data Loss Prevention violations, suggesting that sensitive supply chain and operational data may be leaving the organization through insufficiently governed channels. Digital transformation driven by precision farming technologies and connected machinery appears to have expanded the attack surface faster than security maturity has developed. Device Control Settings top its misconfiguration list, consistent with its growing IoT and automated machinery footprint. |
| Telecommunications 39.9 CRI | Telecommunications enters the top five for the first time, managing concurrent transitions across cloud-native architecture, 5G deployment, and software-defined infrastructure. It is the only sector in the top five with both inbound email policy violations and outbound data loss prevention failures simultaneously in its top risk events—a risk profile that extends beyond the organization to the customers and critical infrastructure that depend on it. |
| Education 39.8 CRI | Education recorded the strongest CRI improvement of any sector, falling from a quarterly peak CRI of 45.1 in early 2024 to 39.8. Four of its five top risk events are identity-related: stale accounts, multi-factor authentication (MFA) disabled, password expiration disabled, and strong password disabled. The structural complexity of managing large, constantly rotating user populations continues to limit how quickly that risk can be resolved. |
| Government and public services 39.7 CRI | Government and public services showed a marginal improvement from 40.3 in 2024. Long procurement cycles, legacy system dependencies, and large distributed workforces are consistent structural factors keeping this sector in the upper risk tier. |
| Communications 39.3 CRI | One of the stronger year-over-year improvements in the top 10, down from 41.6 in 2024. Email-borne threats and data loss prevention violations continue to dominate its risk profile, and Possible Disabling of Antivirus Software topping its XDR detections suggests adversaries are actively working to neutralize defenses once inside. |
| Financial services 38.9 CRI | MFA-disabled accounts persist as a top risk event despite financial services being among the most heavily regulated industries for cybersecurity, pointing to the gap between policy requirements and operational implementation across legacy systems and third-party integrations. |
| Utilities 38.9 CRI | Utilities enters the top 10 for the first time. The convergence of OT and IT networks is expanding the attack surface, and many industrial control systems now being networked were designed for reliability rather than security, creating vulnerabilities that standard patching cycles are not equipped to address. |
| Insurance 38.8 CRI | Insurance improved from 41.0 in 2024. A more diversified multi-cloud environment than most sectors, including Google Cloud Platform (GCP) alongside Amazon Web Services (AWS) and Microsoft Azure, is introducing governance complexity that may be slowing remediation. |
Risk by company size: the mid-enterprise segment carries the highest CRI
Organizations with 5,001 to 10,000 employees carry the highest CRI of any size segment at 41.5, exceeding even the largest enterprises. This segment operates with network complexity comparable to organizations above 10,000 employees but typically without the security operations maturity or staffing depth of that scale. The largest enterprises recorded the biggest absolute improvement, falling 3.8 points from 2024 to 40.4, likely reflecting the scale benefits of centralized risk management programs. Organizations with 100 or fewer employees are the only size band to record a CRI increase year-over-year, rising to 32.4, consistent with growing attacker interest in small businesses as entry points into larger supply chains.
Cloud access and identity dominate the risk event list for the second consecutive year
7 of 10
Top 10 risk events that are identity-related
4 of 5
Education's top 5 risk events that are directly identity-related
Risky Cloud App Access holds at number one and Stale Microsoft Entra ID Account at number two, both for the second year running. Seven of the top 10 risk events are identity-related, including MFA-disabled accounts at number four and password expiration disabled at numbers seven and nine. Their continued presence at the top of the list for two consecutive years suggests awareness of the problem has not translated into systematic remediation.
ZTSA (Zero Trust Secure Access) Rule Match - Private Access Control enters the top five for the first time, likely reflecting expanded zero trust adoption generating visibility into policy violations that previously went undetected. The concurrent presence of stale accounts and MFA failures in the same top 10 suggests zero trust frameworks are being deployed on top of identity foundations that have not yet been cleaned up.
Security misconfigurations are co-occurring across the same environments
Web Reputation Settings tops the endpoint misconfiguration list for the second consecutive year. Anti-Malware Scanning, Predictive Machine Learning, Endpoint Sensors, Firewall, Application Control, and Behavior Monitoring settings are simultaneously unoptimized across thousands of environments. These are not independent gaps: each weakness compounds the others. In cloud environments, Application Control Settings, Firewall Settings, and Log Inspection Settings top the cloud misconfiguration list, pointing to a persistent gap between deployment and operationalization of cloud workload protection.
"The gap is not one of technology but of operationalization. Misconfigurations persist in solutions capable of enforcing optimal settings. Identity risks accumulate in platforms capable of automating account lifecycle management. Vulnerabilities remain unpatched despite available fixes."
Attackers are prioritizing defense evasion as a first-stage objective
Possible Disabling of Antivirus Software tops the XDR model hits list in 2025, displacing Possible OS Credential Dumping from the position it held in 2024. The shift suggests adversaries have moved toward neutralizing endpoint defenses as a first-stage objective rather than attempting to evade them. Registry Run Key Creation in Temp Location, Backdoor File Detection, and Hacking Tool detections follow in the top 10, tracing a consistent attacker sequence: disable defenses, establish persistence, escalate privileges, move laterally.
Do not assess vulnerability risk in isolation: lower severity CVEs can amplify higher severity ones
115 days
Average TrendAI™ TippingPoint™ virtual patch lead time, measured from vulnerability discovery
39 days
Average time for attackers to weaponize a vulnerability after public disclosure
All 10 of the most detected unpatched Common Vulnerabilities and Exposures (CVEs) are from 2025. Remote Code Execution (RCE) vulnerabilities—including CVE-2025-24035 (Windows Remote Desktop Services, 8.1 High) and CVE-2025-21376 (Windows Lightweight Directory Access Protocol, or LDAP, 8.1 High)—enable attackers to execute arbitrary code remotely. Elevation of Privilege (EoP) vulnerabilities—including CVE-2025-24044 (Windows Kernel-Mode Driver, 7.8 High) and CVE-2025-21420 (Windows system utilities, 7.8 High)—provide the escalation pathway from initial foothold to full system control. Unpatched RCE and EoP vulnerabilities in the same environment provide attackers with a complete compromise pathway.
Three of the top 10 CVEs carry medium severity scores: CVE-2025-24992 (5.5), CVE-2025-21247 (4.3), and CVE-2025-21377 (6.5). None are independently critical, but each may directly enable the high-severity exploits on the same list—enabling local information disclosure, bypassing content security, or disclosing NTLM hashes for lateral movement. Organizations that deprioritize these based on Common Vulnerability Scoring System (CVSS) score are leaving in place the conditions that make high-severity exploits more reliable.
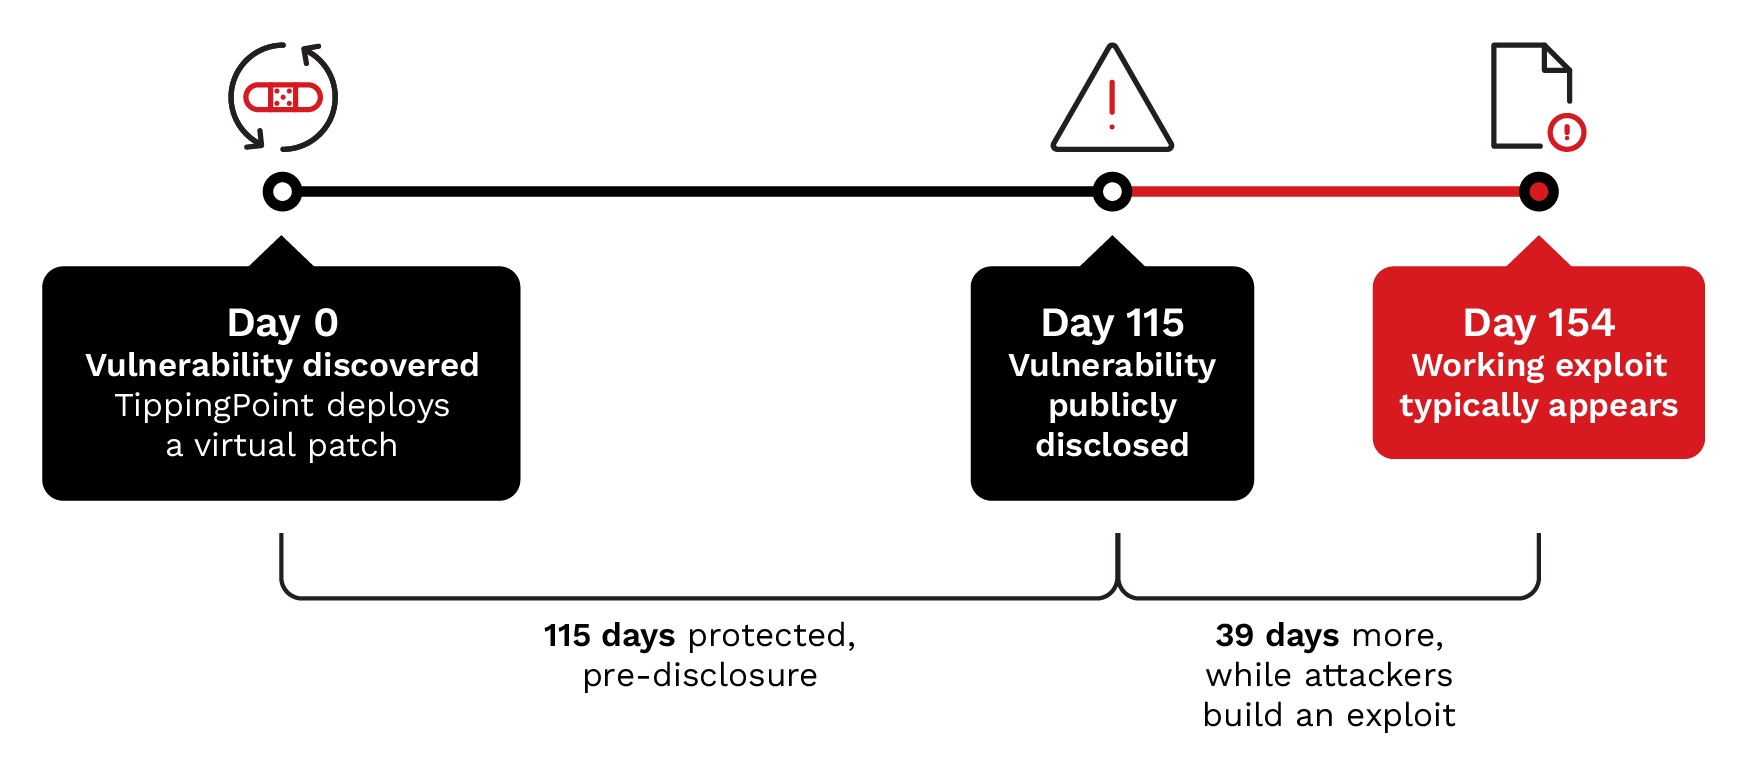
TrendAI™ TippingPoint™ data suggests virtual patching can help bridge the gap: the average virtual patch lead time for 2025 vulnerabilities sits at 115 days from discovery, while attackers weaponize known vulnerabilities in an average of 39 days from public disclosure. Because discovery always precedes disclosure, virtual patching can provide a window of protection before a vulnerability becomes publicly known and actively targeted. The risk is treating virtual patching as a substitute for formal patching rather than a bridge to it.
Attack Path Prediction maps how adversaries move—not just where exposures exist
2,317,503
Attack paths initiated by unpatched vulnerabilities
1,135,327
Attack paths initiated by password spraying
880,527
Attack paths initiated by password guessing
This year's report introduces telemetry from the TrendAI Vision One™ Attack Path Prediction capability, which models the chained sequences adversaries follow from an initial foothold through to a high-value target. Where the Cyber Risk Index measures current exposure, Attack Path Prediction simulates how that exposure may be exploited. Because full-year 2025 data was not yet available, this section should be read as a directional view of emerging patterns rather than a complete annual measurement.
Unpatched vulnerabilities are the single largest source of active attack paths, appearing at the head of 2,317,503 predicted paths, about 15% more than the combined total of the next two categories. Password spraying (1,135,327 paths) and password guessing (880,527 paths) rank second and third, feeding directly on the identity hygiene failures documented throughout this report.
Public IP addresses are the most common entry point asset type, averaging 4,979 assets per day. Domain assets—Domain Name System (DNS) hostnames attached to those IP addresses—average 2,781 per day, together defining the perimeter exposure dimension of attack path initiation. At the other end of the chain, user accounts are the most common terminal target, averaging 32,964 targeted assets per day, nearly double the second-ranked asset type (devices, at 18,445). The identity risks that elevate CRI scores appear to be the same conditions that make user accounts the preferred destination for adversary attack chains.
Ransomware ecosystem records 236% growth in confirmed breaches
236%
Growth in confirmed ransomware breaches across the top 10 groups, 2024 to 2025
1,270%
Year-over-year breach count increase by 2025’s most prolific group, Qilin
Total confirmed ransomware breaches across the top 10 groups grew from 1,518 in 2024 to 5,096 in 2025. Five groups enter the top 10 for the first time: INC Ransom (558 breaches), SafePay (509), Lynx (279), DragonForce (264), and Sinobi (252). LockBit, ranked second in 2024, has dropped off the top 10 entirely following law enforcement disruption. RansomHub fell from first in 2024 to tenth in 2025 with 213 breaches.
Qilin (detected by TrendAI™ as Agenda) climbed from last place in 2024 to first in 2025 with 1,262 confirmed breaches, a 1,270% increase. It operates as a ransomware-as-a-service platform, meaning its growth reflects an expanding affiliate network. Akira grew from 106 to 857 breaches, a 708% increase, making it the second most active group. The rapid entry of multiple new groups at scale suggests that disrupting established ransomware operations redistributes rather than reduces the overall threat.
The capability to address identified risks already exists in deployed tools
The consistent pattern across this report's findings is not a technology gap but an operationalization gap. Misconfigurations persist in solutions capable of enforcing optimal settings. Identity risks accumulate in platforms capable of automating account lifecycle management. Medium-severity CVEs are deprioritized despite their documented role in enabling high-severity exploits. The TrendAI Vision One™ Cyber Risk Exposure Management (CREM) solution provides continuous attack surface visibility, unified risk scoring, XDR-powered detection and response, and automated remediation. Organizations that made the most measurable progress in 2025 are those that moved from periodic security reviews to continuous, intelligence-led risk management.
Like it? Add this infographic to your site:
1. Click on the box below. 2. Press Ctrl+A to select all. 3. Press Ctrl+C to copy. 4. Paste the code into your page (Ctrl+V).
Image will appear the same size as you see above.

Artículos Relacionados
- Hunt Them All: An AI-Powered Vulnerability Sweep of 19,000 MCP Servers
- It’s By Design: The Use-After-Free of Azure Cloud
- Ransomware Spotlight: Agenda
- Azure Control Plane Threat Detection With TrendAI Vision One™
- Forecasting Future Outbreaks: A Behavioral and Predictive Approach to Proactive Cyber Risk Management
Artículos Recientes
- TrendAI™ 2026 Cyber Risk Report
- The Hidden Risk in Your AI Rollout: Your Endpoints
- When AI Becomes a Zero-Day Machine: What Public Sector Organizations Need to Know
- A Data-Driven View of Cyber Risk Structure: How Attack Pressure and Exposure Shape Damage
- Hunt Them All: An AI-Powered Vulnerability Sweep of 19,000 MCP Servers
Fault Lines in the AI Ecosystem: TrendAI™ State of AI Security Report

It’s By Design: The Use-After-Free of Azure Cloud

TrendAI™ 2026 Cyber Risk Report
Guarding LLMs With a Layered Prompt Injection Representation