
By Marco Balduzzi (Technical Research Lead, Forward-Looking Threat Research Team), Roel Reyes (Senior Threat Researcher, Forward-Looking Threat Research Team), Jessica Balaquit (Threat Researcher, ML/AI Research), Ryan Flores (Director of Technology Research, Threat Research), Benjamin Zigh (Director, Threat Research Insights)
Key takeaways
- A study by TrendAI™ Research confirms that endpoint risk is not random; user behavior strongly influences it. Behaviors such as installing large numbers of applications, visiting gambling sites, or using devices primarily at night significantly increase exposure to specific malware types.
- The analysis of high-risk endpoints identified in this multi-engine study revealed that certain behaviors directly influence exposure to different malware classes, supporting the assumption that cybercriminals tailor campaigns to target specific victims and business models.
- By combining behavioral analytics with advanced statistical modeling, the research establishes a clearer, explainable way to anticipate malware exposure — enabling organizations to proactively pinpoint higher‑risk users and machines and strengthen their defenses.
The increasing sophistication and scaling of malware and ransomware attacks drive up costs, resource consumption, and operational downtime in organizations worldwide as they grapple with the continuous onslaught of threats. While security solutions and platforms that center on anti-malware technology are reliable and essential, the rapid evolution of cyberthreats demands that the tried-and-tested reactive approach to cyberattack mitigation be supplemented with solutions that allow an organization to be proactive and strategically plan its defense.
To answer this call, TrendAI™ has introduced TrendAI Vision One™, which applies key principles to operational environments. TrendAI Vision One™ Cyber Risk Exposure Management (CREM) and TrendAI Vision One™ Cyber Risk Quantification (CRQ) use telemetry and analytics to assess endpoint, network, and user activity, which in turn enable the estimation of future malware outbreak probabilities and support risk-driven decision-making.
Contributing to industry-wide efforts to outpace cybercriminals, TrendAI™ Research conducted a study to see how else the likelihood of a future malware outbreak could be forecast based on the idea that many threats do not occur randomly but are influenced by the behavior of users who later become victims. To support this assumption that a user’s behaviors have a bearing on the likelihood of their becoming a victim, TrendAI™ Research analyzed high-volume, real-time activity data that included web traffic, application usage, and user interactions to statistically model and quantify risk. The collected behavioral user data was then employed to estimate the risk of future attacks using two integrated analysis engines.
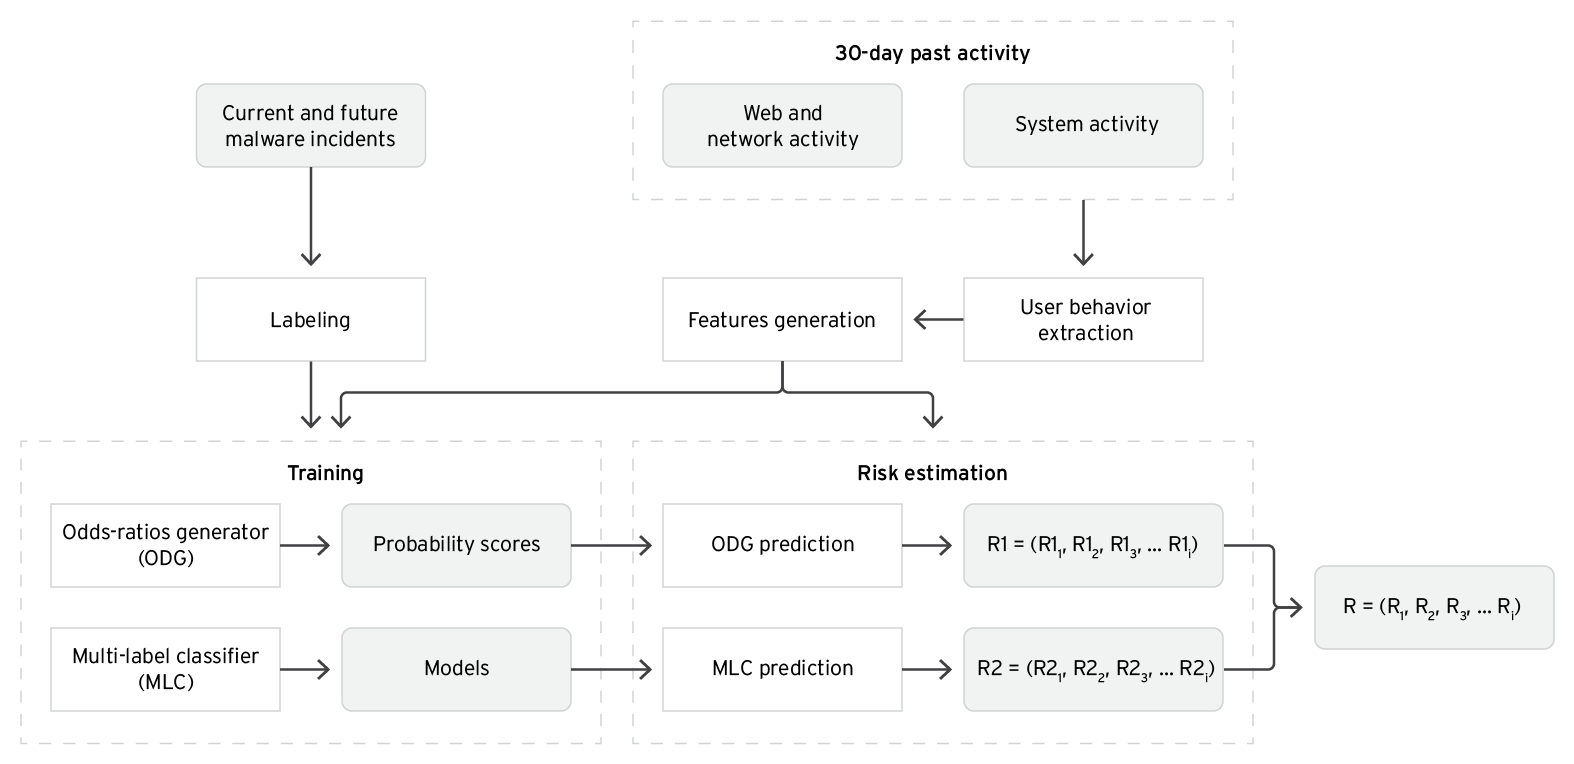
Figure 1. System architecture of the new approach proposed by this study
The first engine, the odds-ratios generator (ODG), is built on a previous study and uses established statistical methodologies to link specific user actions to future infections for different threat categories. Some notable results of the odds-ratio generation are shown in Figure 2.
Confirming the research assumption, the ODG results show that using a large number of software applications (more than 159) increases the probability of encountering backdoored software, such as trojans, by 61%. This is understandable because in a desktop environment where users are allowed to download and install any application found over the internet (suggesting that there are no enterprise policies defining application whitelists in place), there is a higher chance that some of these applications contain malware.
Interestingly, visiting gambling websites exposes users to the risk of encountering potentially unwanted applications (PUAs, +91%), trojans (+78%), and hacking tools or “hacktools” (+37%), but not cryptocurrency miners or “coinminers,” ransomware, or viruses. This is because certain classes of malware spread via certain categories of websites due to the different distribution models used by cybercriminals in their campaigns.
Additionally, if an endpoint is used primarily at nighttime (85% of the time), there is up to 92% more risk of ransomware infection. This can be attributed to users behaving in a more unsafe manner at nighttime, which can include behaviors like visiting shady websites and clicking or downloading unverified links or files.
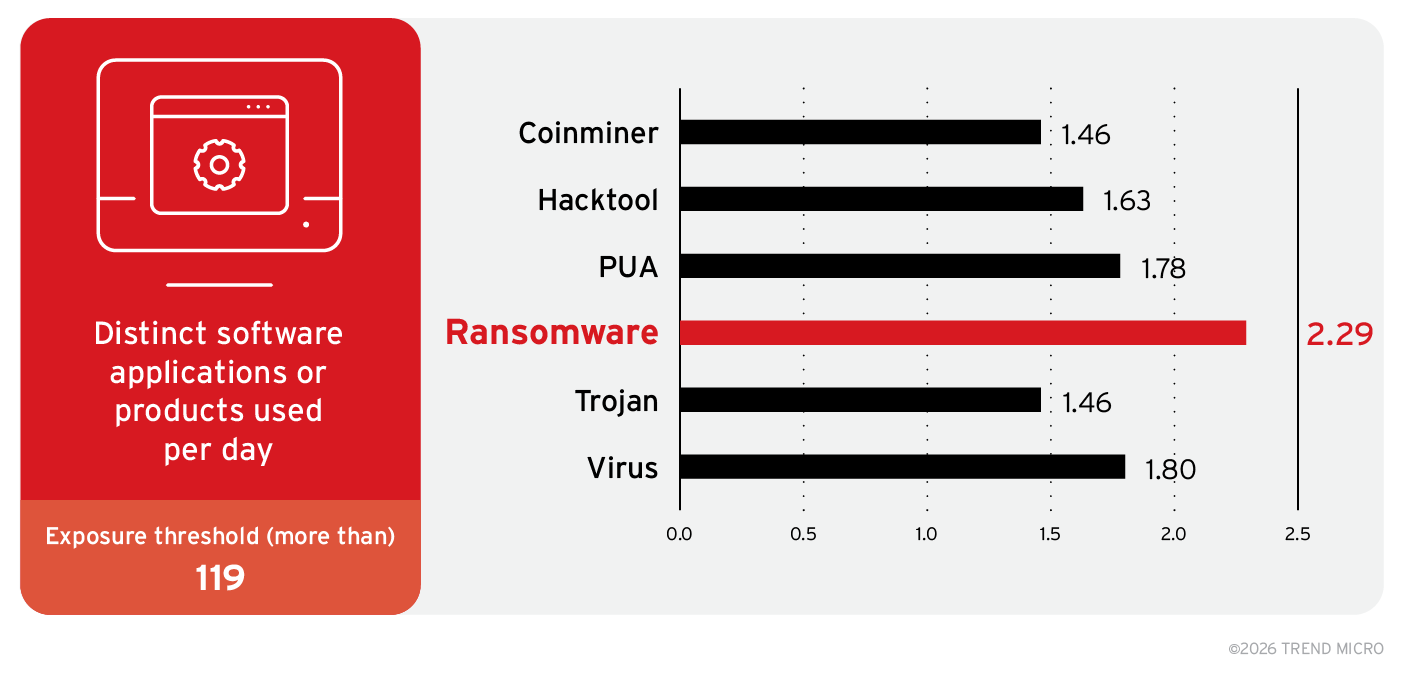
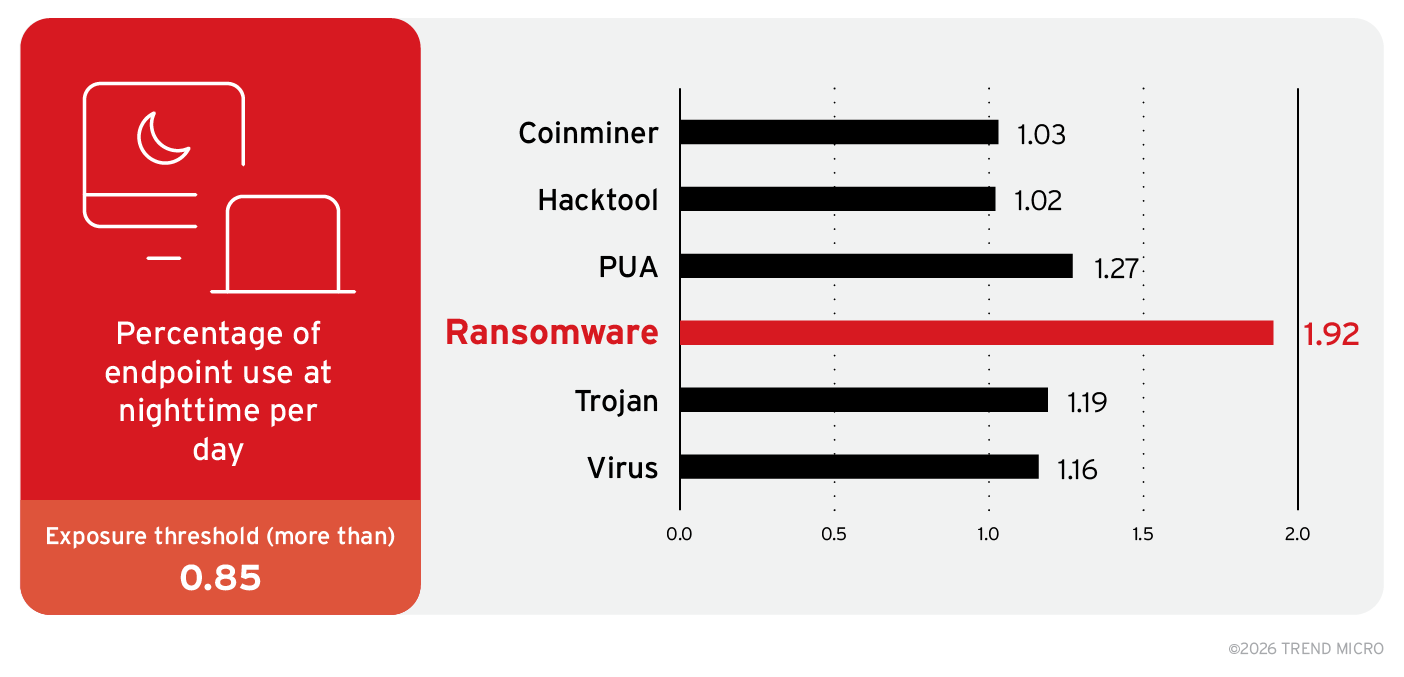
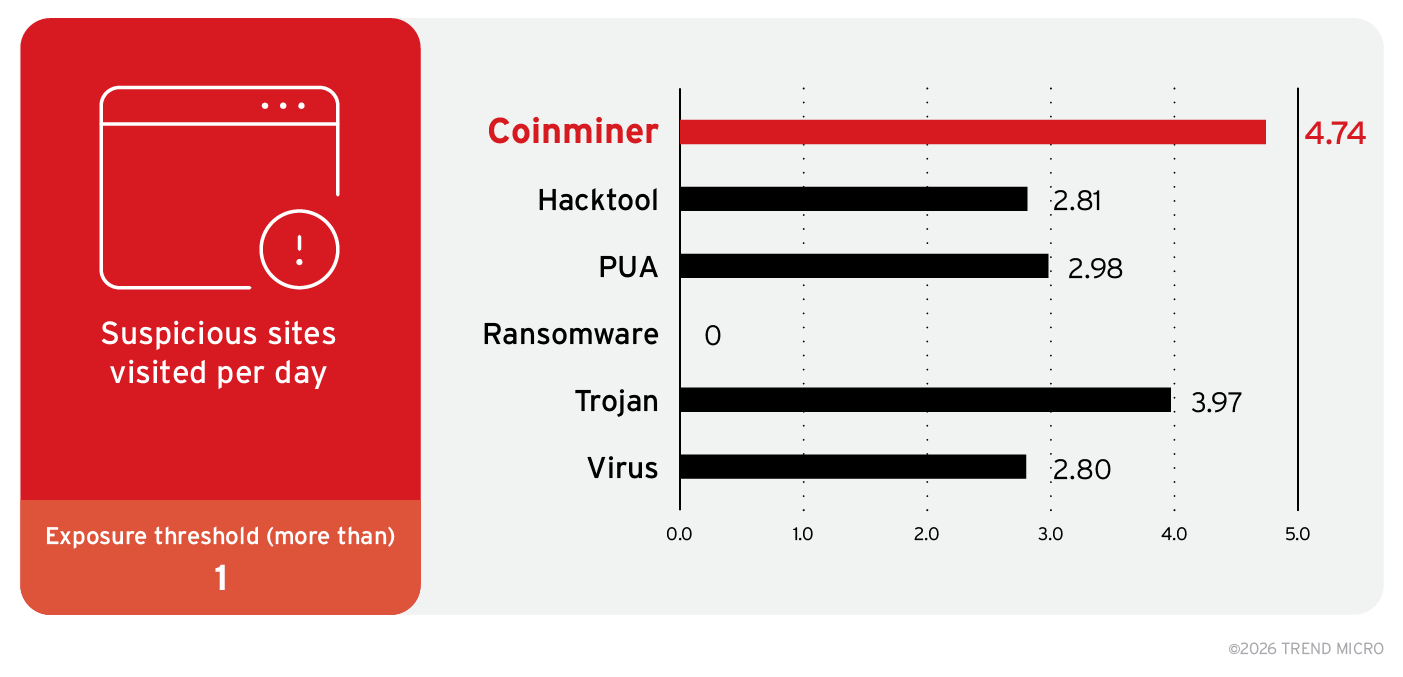
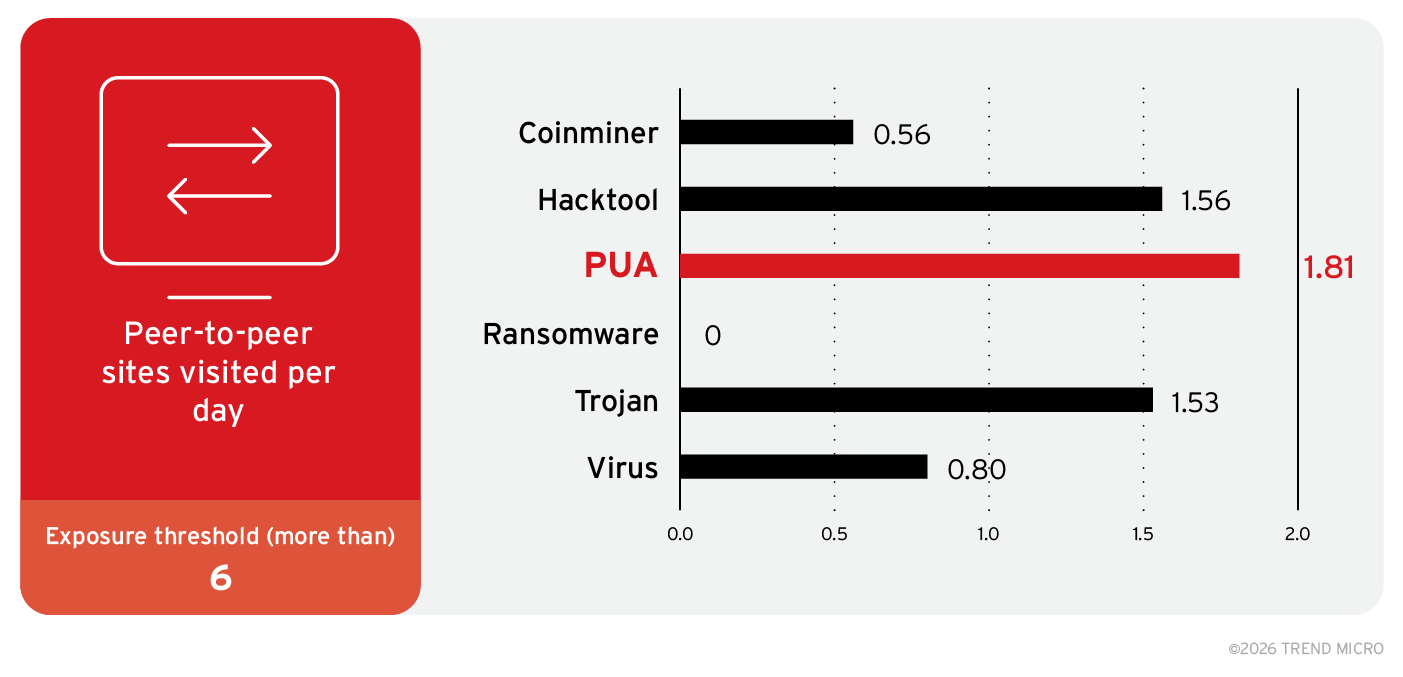
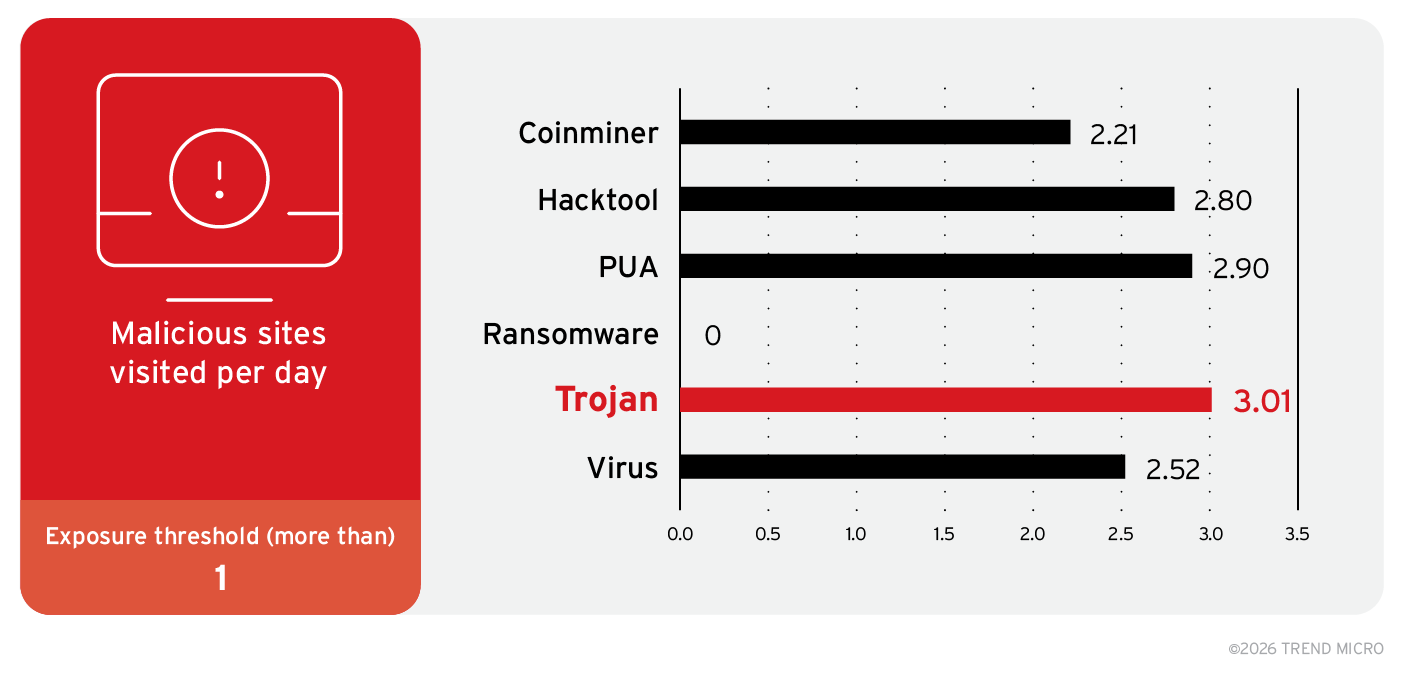
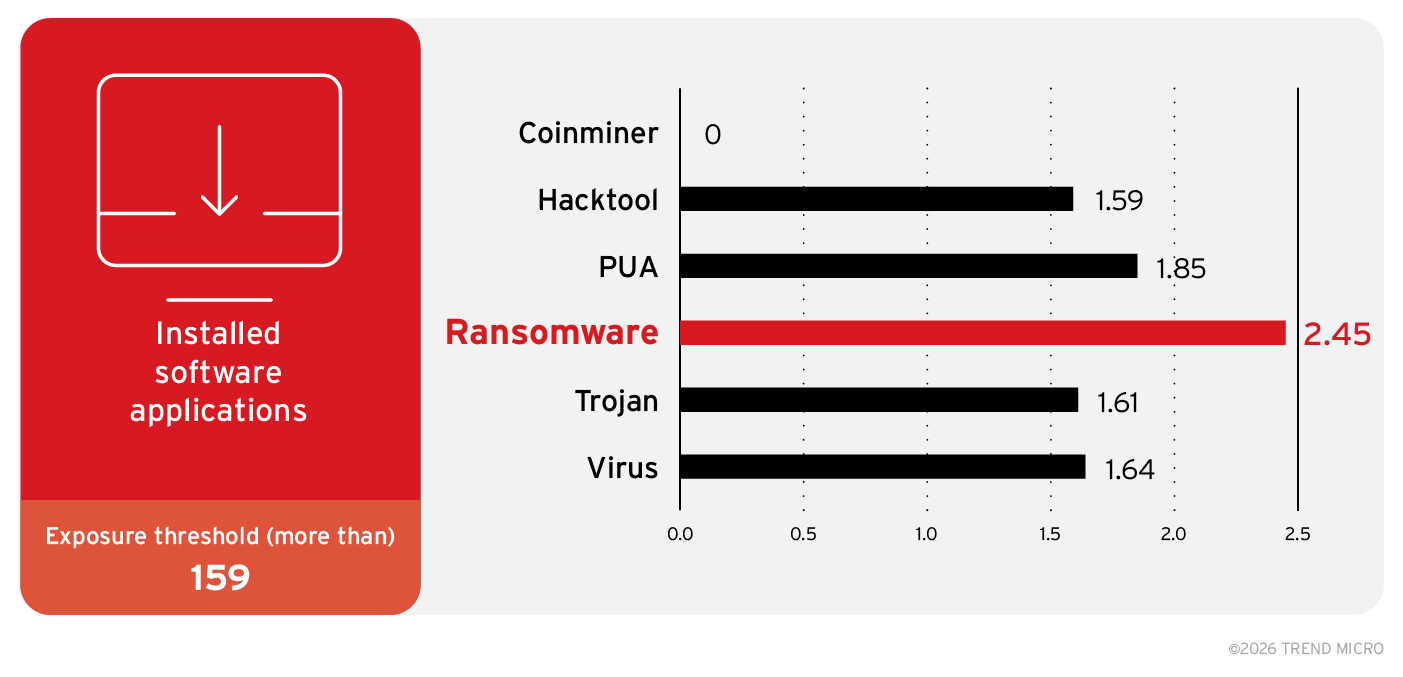
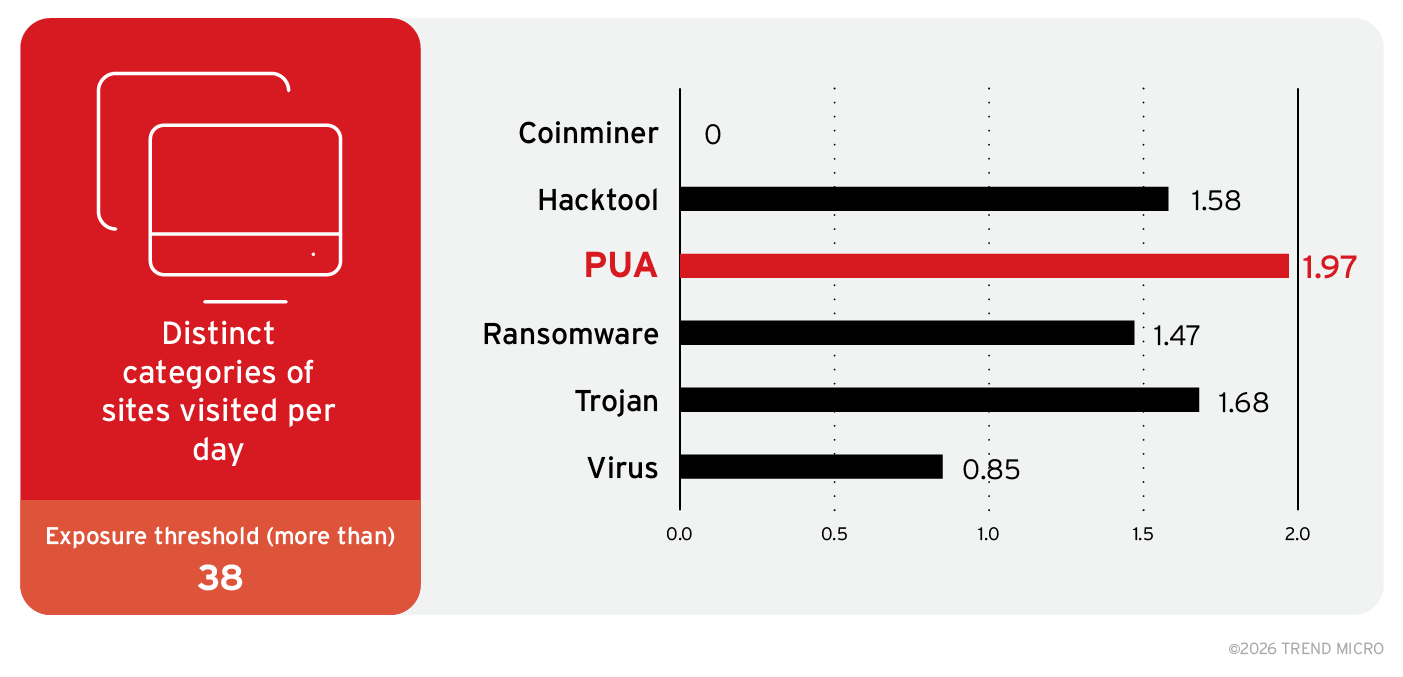
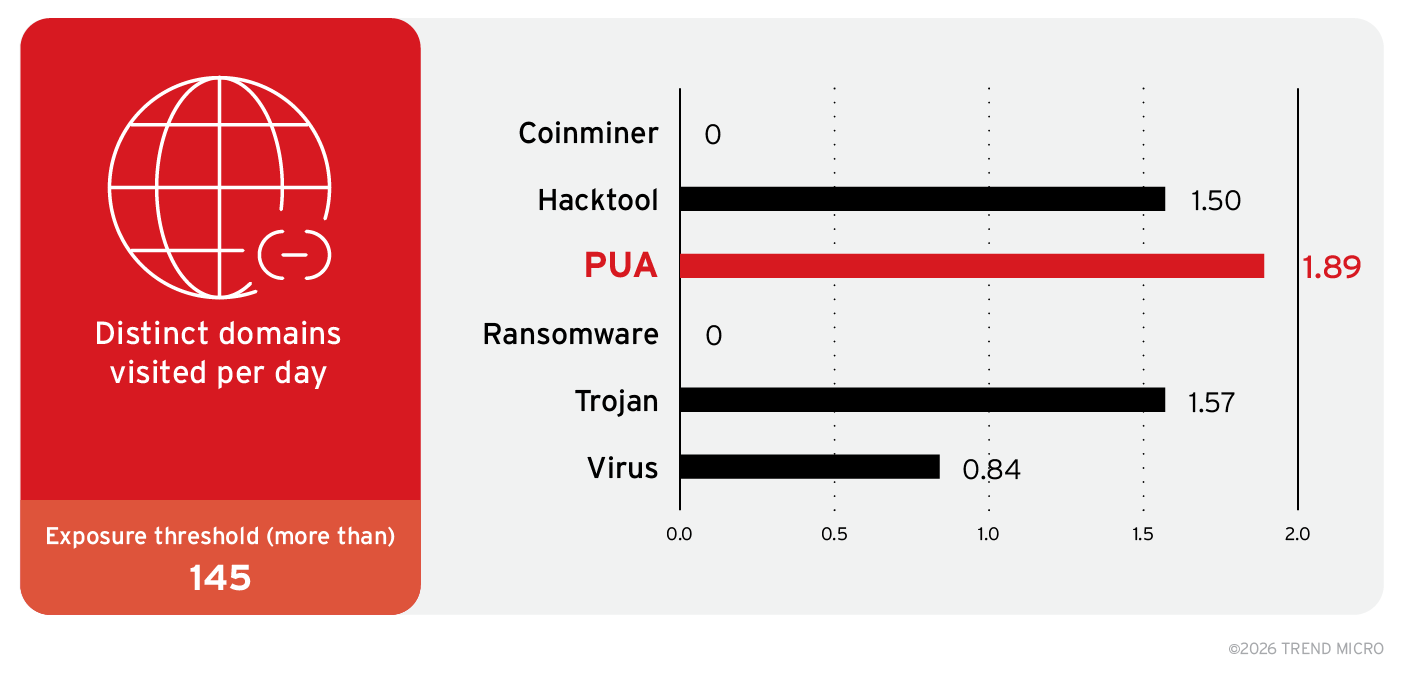
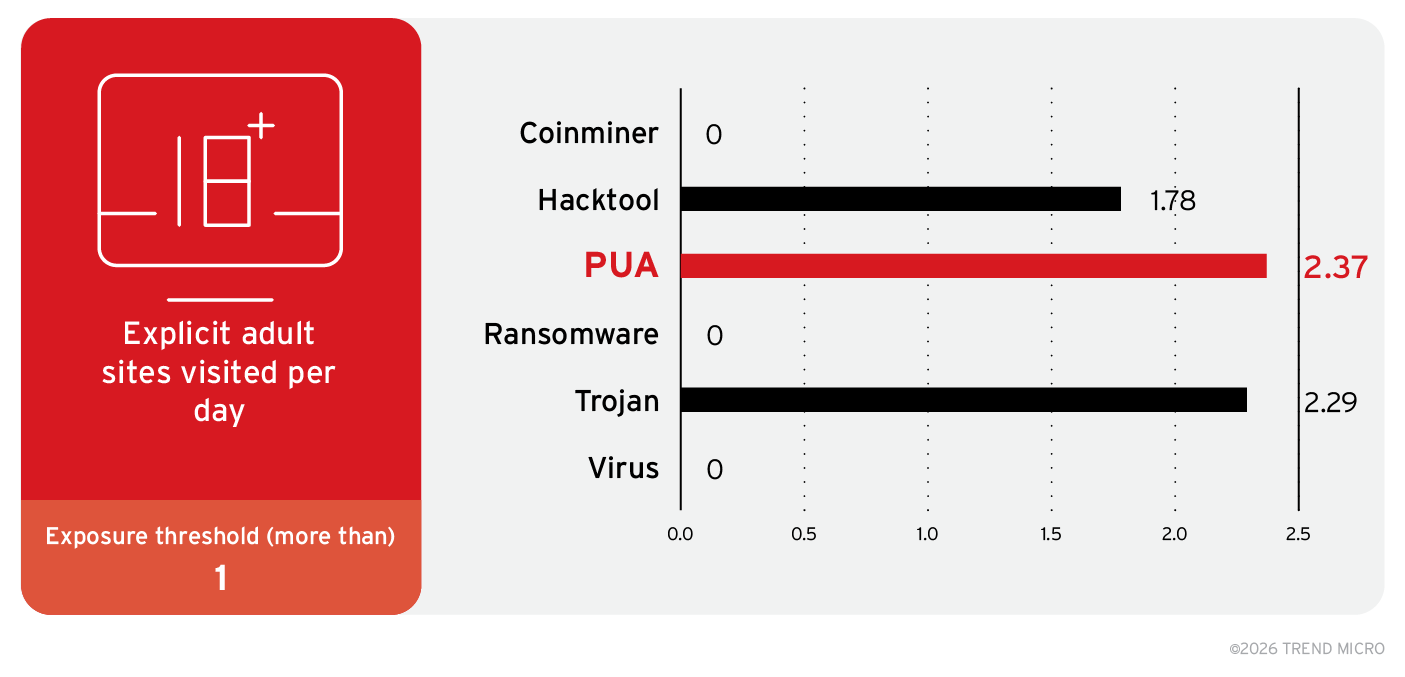
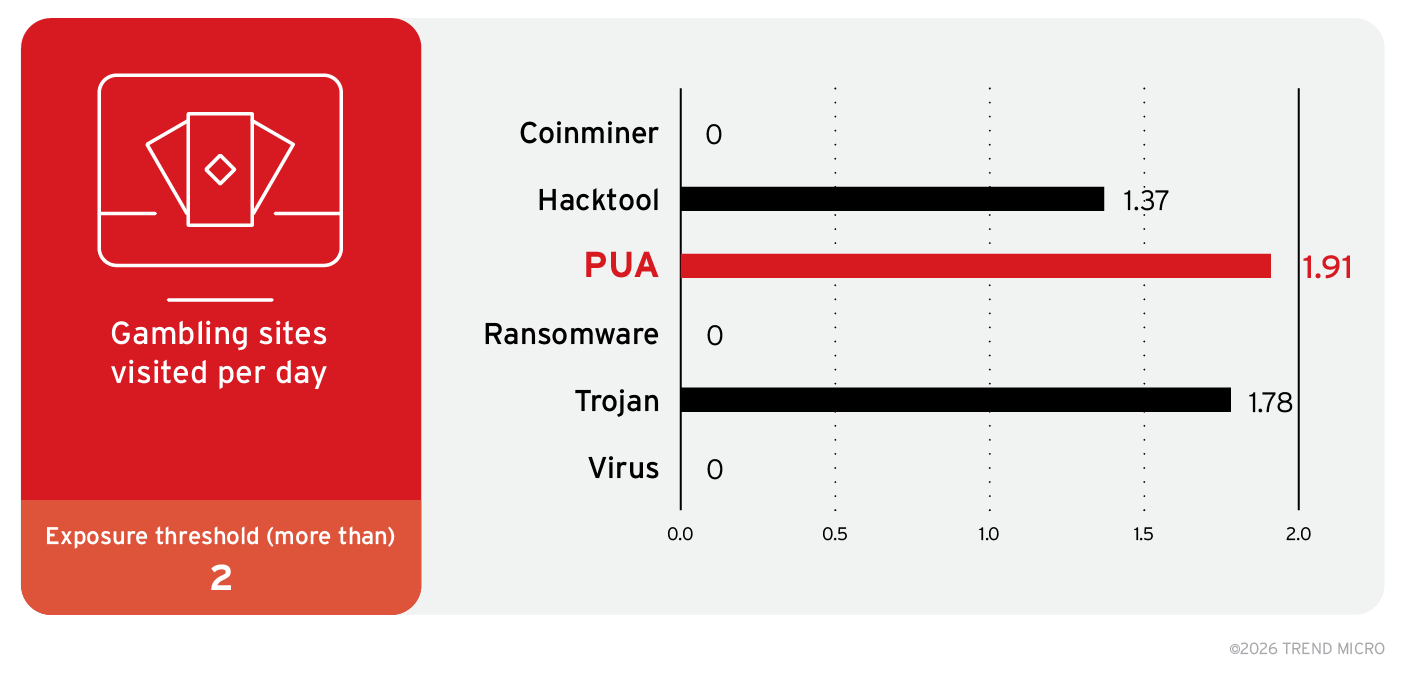
Figure 2. Notable user behaviors that put machines at risk of each malware class based on the results of the odds-ratios generation during training. The figures represent the likelihood of the machines being exposed to each malware class when the behavior meets or exceeds the exposure threshold.
The second engine, the multi-label classifier (MLC), refines these insights using advanced modeling, allowing TrendAI™ Research to simultaneously predict the probability of six classes of malware — coinminer, hacktool, PUA, ransomware, trojan, and virus — hitting a specific machine.
After analyzing 10.7 million endpoints across 217 countries and 822 organizations over a period of one month, TrendAI™ Research found that, as shown in Table 1, 31.61% of the analyzed population falls within the low 0–20 risk range, over half (57.55%) of the machines are at medium risk (21–40 and 41–60), and 10.36% and 0.48% fall within the high 61–80 and 81–100 risk ranges, respectively. This highlights that while extreme risk is rare, the majority of users operate in a vulnerable middle zone that should still work on improving their security posture by maximizing proactive security platforms and investing in user behavior training.
| Estimated risk | |||||
|---|---|---|---|---|---|
| Malware class | 0–20 | 21–40 | 41–60 | 61–80 | 81–100 |
| Coinminer | 45.91 | 44.75 | 8.42 | 0.88 | 0.04 |
| Hacktool | 23.37 | 40.55 | 22.21 | 13.08 | 0.79 |
| PUA | 27.82 | 30.85 | 18.82 | 21.60 | 0.91 |
| Ransomware | 32.53 | 39.08 | 20.26 | 7.79 | 0.34 |
| Trojan | 21.82 | 40.84 | 21.83 | 14.85 | 0.66 |
| Virus | 38.23 | 43.85 | 13.80 | 3.99 | 0.13 |
| Overall risk | 31.61 | 39.99 | 17.56 | 10.36 | 0.48 |
Table 1. Overall risk estimation for the 10.7 million endpoints included in this study
The endpoints identified as highly exposed to malware outbreaks (with scores of 81–100) were analyzed to understand their usage within corporate networks to validate the initial assumption that the way in which a machine is utilized is a main factor in its becoming a victim of a specific class of malware. For each malware class, 500 high-risk endpoints were randomly sampled, from whose system activity logs a list of installed applications, such as engineering software, enterprise resource planning (ERP) platforms, and games, were extracted. This list was further refined by excluding DLL files, drivers, and known OS applications, and removing redundant product names to improve computational performance. Figures 3 and 4 summarize the results of this analysis.
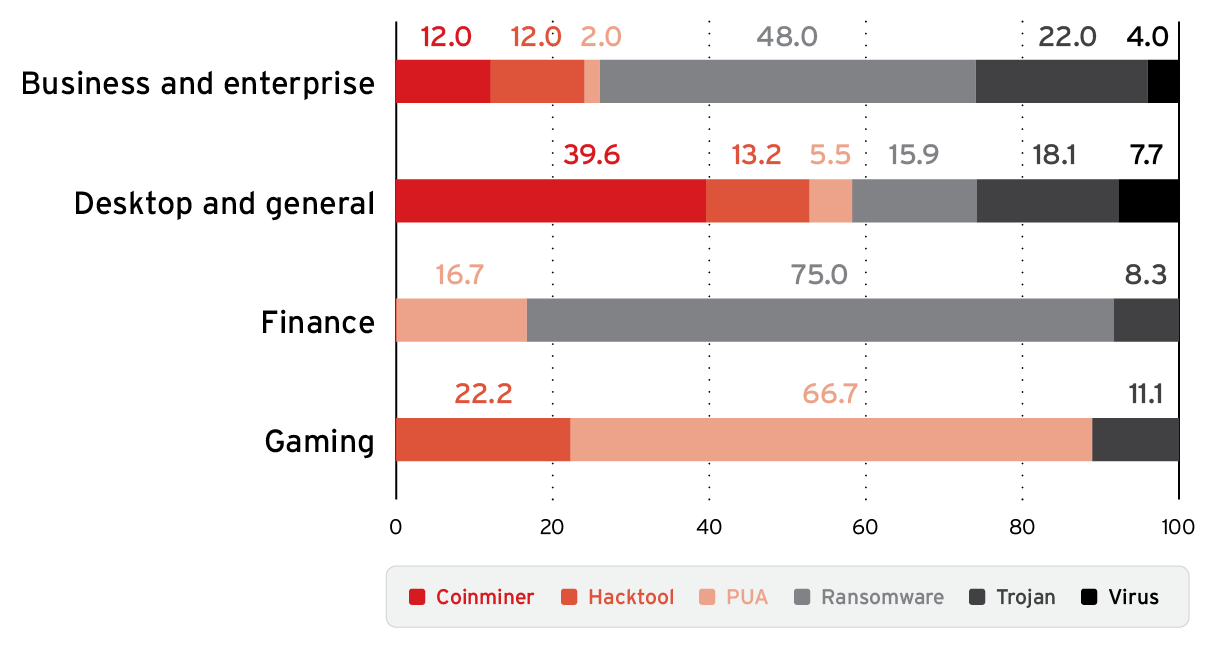
Figure 3. Number of endpoints at very high risk, categorized by endpoint usage (values expressed in percentages of the total 10.7 million endpoints analyzed)
It should be noted that most of the total 10.7 million endpoints included in this study were situated in very large enterprises consisting of networks used for business purposes, including regular desktop computers for day-to-day office tasks, high-end machines for specialized operations, and servers.
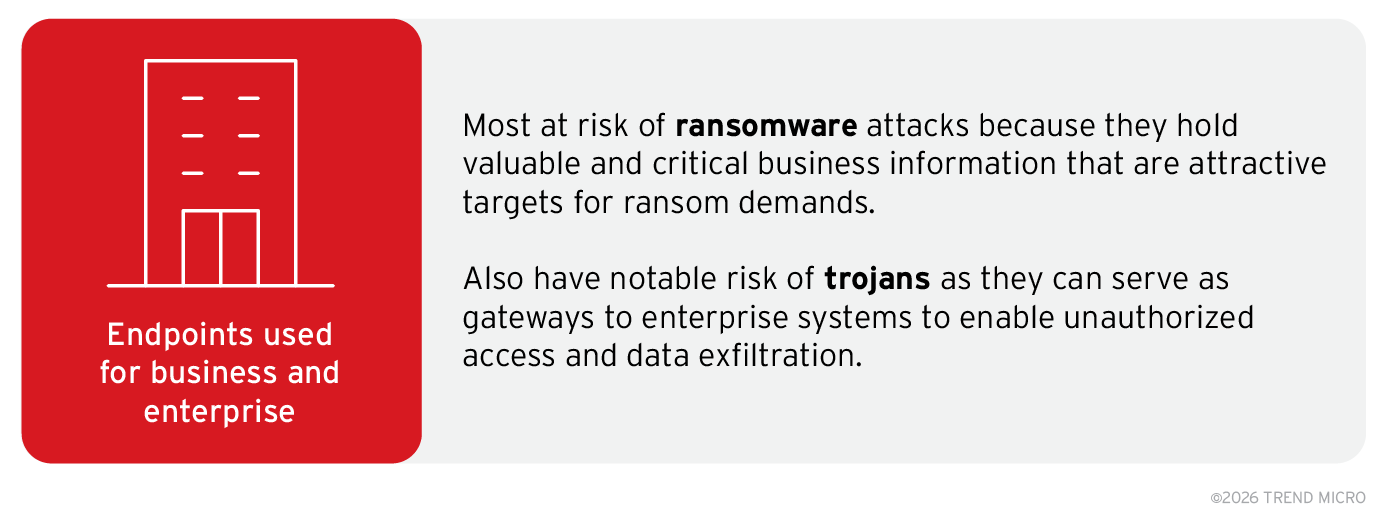
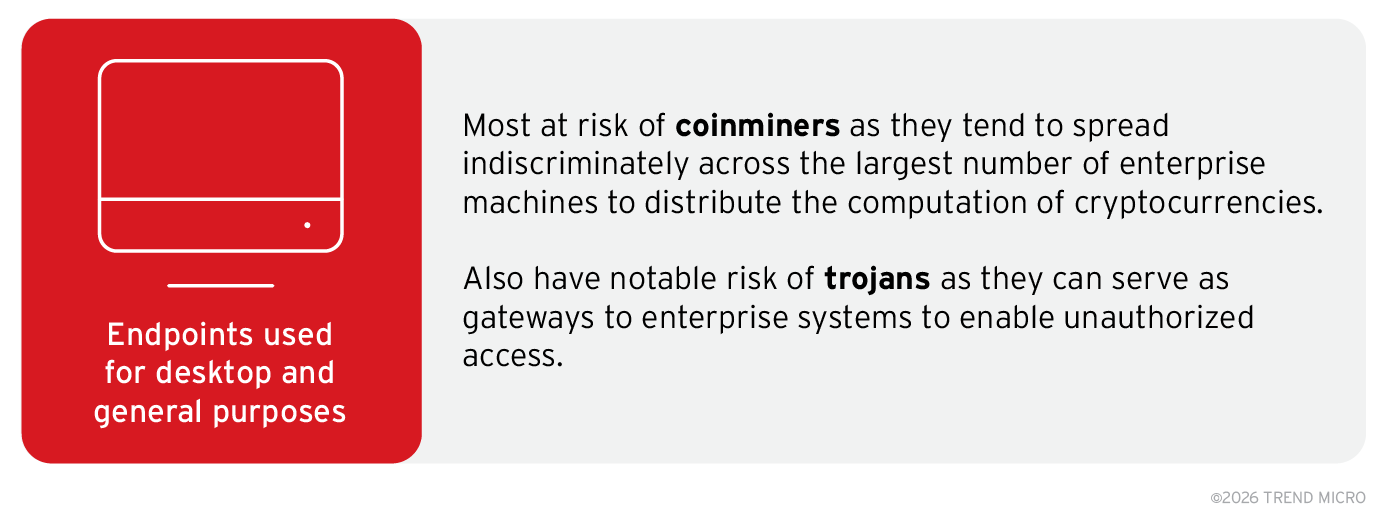
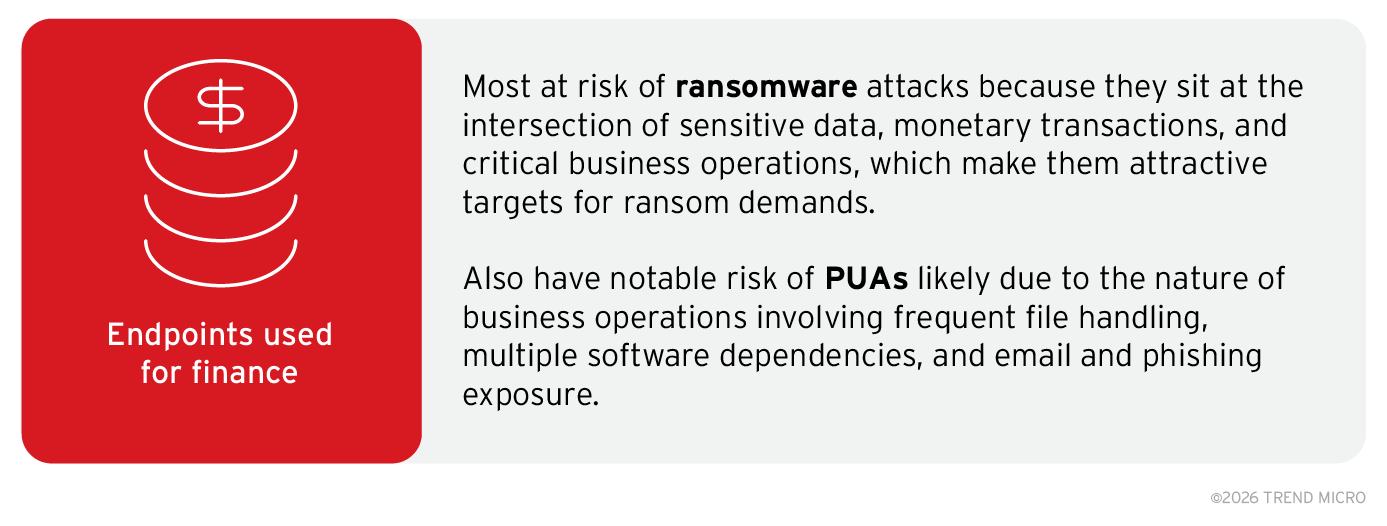
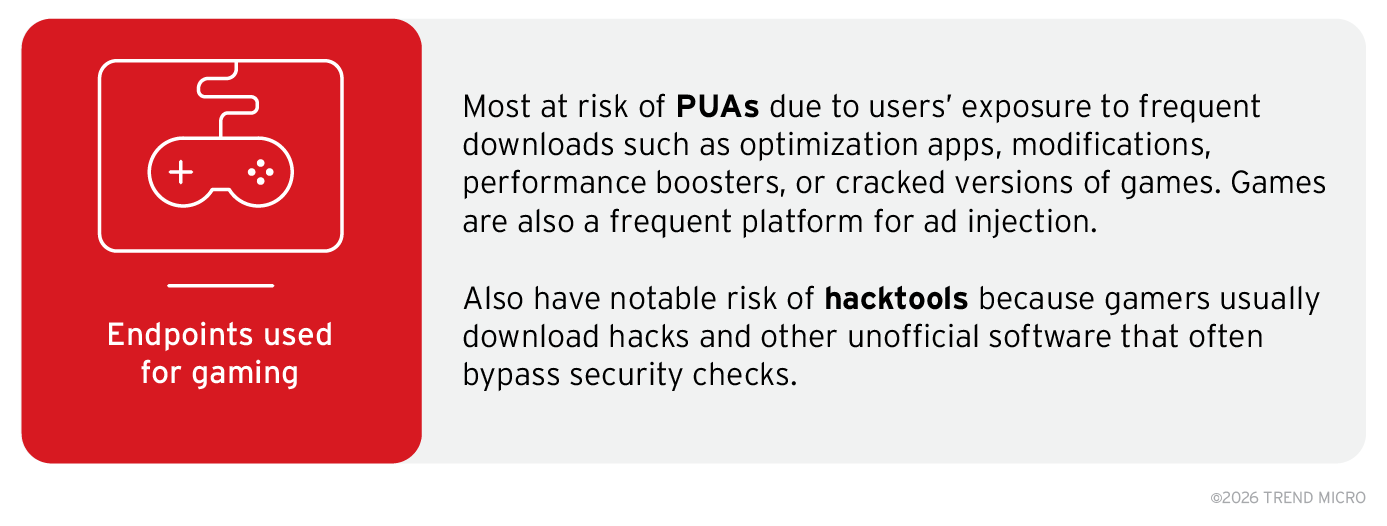
Figure 4. Key findings from the analysis of how the specific usage of endpoints influences how much they are at risk of encountering specific malware classes
Findings from this study confirm that risk is highly specific as cybercriminals operate malware campaigns in different forms and with different intentions based on their need for specific types of victims and business models. A user’s behavior, both on the machine and over the internet, is then a primary factor for driving infection risk estimation. Download our full research paper to learn more about how TrendAI™ Research quantified this correlation, and download our customer advisory for more key takeaways.
Cumulative results were drawn to derive key threat information to foster product innovation and competitive advantage, directly contributing to the improvement of the Cyber Risk Index (CRI) within CREM. By employing odds-ratio analysis and multi-label classification, explainable risk scores for specific malware classes based on observed behaviors are generated. The methodologies described in this research are actively informing the evolution of CREM and the CRI, providing a foundation for proactive security strategies that address the full spectrum of malware threats and allowing organizations employing TrendAI Vision One™ to identify endpoints and users with elevated risk profiles and to prioritize controls accordingly.
Like it? Add this infographic to your site:
1. Click on the box below. 2. Press Ctrl+A to select all. 3. Press Ctrl+C to copy. 4. Paste the code into your page (Ctrl+V).
Image will appear the same size as you see above.
Artículos Recientes
- TrendAI™ 2026 Cyber Risk Report
- The Hidden Risk in Your AI Rollout: Your Endpoints
- When AI Becomes a Zero-Day Machine: What Public Sector Organizations Need to Know
- A Data-Driven View of Cyber Risk Structure: How Attack Pressure and Exposure Shape Damage
- Hunt Them All: An AI-Powered Vulnerability Sweep of 19,000 MCP Servers
 Fault Lines in the AI Ecosystem: TrendAI™ State of AI Security Report
 It’s By Design: The Use-After-Free of Azure Cloud
 TrendAI™ 2026 Cyber Risk Report
 Guarding LLMs With a Layered Prompt Injection Representation