Proactive Security: The Role of Exposure Management and Detection-Response Capability
Proactive Security:
The Role of Exposure Management and Detection-Response Capability
 Download the primer
Cyberattacks are growing increasingly sophisticated and frequent, which is why security strategies focused solely on detection and response are no longer sufficient. This reality brings renewed attention to the importance of identifying and mitigating cyber risks before incidents occur.
This article presents a statistical analysis of telemetry data from 190 enterprise organizations, examining how two factors — cyber risk exposure and the adoption of Trend Micro™ Managed Detection and Response (MDR) — affect the likelihood of damage resulting from cyberattacks. Drawing on these findings, we outline key recommendations for building a proactive security posture.
Key Findings:
- Higher exposure significantly increases the risk of damage. Organizations with high cyber risk exposure have higher chances (up to 2.6 times more) of incurring damage from cyberattacks — specifically, Exfiltration (TA0010) and Impact (TA0040) as defined by the MITRE ATT&CK framework — than those with low exposure.
- MDR is more effective when combined with exposure management. A general trend toward lower incident rates is observed among organizations using MDR. It suggests a potential effect worth considering, especially in combination with exposure management.
- The most secure setup is found in organizations that combined MDR with low exposure. Organizations combining MDR with low exposure had the lowest damage rate at 13.3%. This demonstrates that organizations should focus first on reducing risk to maximize the value of a security operations center (SOC) or MDR.
Strengthening Your Security Posture: Key Recommendations
- Visualize and reduce risk. Leverage solutions such as Trend Vision One™ Cyber Risk Exposure Management (CREM) to identify vulnerabilities and misconfigurations, assign business-driven priorities, and systematically reduce risk exposure.
- Strengthen detection and response readiness. Establish effective capabilities through Extended Detection and Response (XDR), utilizing in-house SOC or outsourcing to an MDR provider to develop clear incident response procedures and define decision-making flows across relevant teams.
- Integrate operations and foster a proactive culture. Align risk management and response operations, support continuous improvement, and embed security awareness and agility across the organization.
Next Steps
- Use CREM to gain clear visibility into risk exposure and reduce it step by step based on well-defined priorities.
- Set up detection and response capabilities in advance using XDR, utilizing in-house SOC or outsourcing to an MDR provider.
- Where needed, engage external experts such as Cyber Risk Advisory Services (CRAS) to help design a proactive strategy tailored to your business environment.
Proactive security isn’t about predicting the future. It’s about building the readiness to face the unexpected and making that readiness part of how your organization operates every day. The quiet success of a day when nothing happens is never a coincidence. It is the result of steady preparation and thoughtful action. Taking that first step — right here, right now — is where organizational cyber resilience truly begins.
As cyberattacks become more sophisticated and constant, simply improving “detection and response” is no longer enough to reduce damage. Many organizations are now discussing the need to move from reactive measures to more proactive risk management. This shift has brought attention to a new approach: cyber risk exposure management.
While it’s still important to respond quickly after an attack, preventing damage before it happens is even more effective. Proactive management of cyber risks — by identifying and reducing potential exposures — can lead to better overall security and fewer incidents.
In this article, we use real-world data from 190 enterprise organizations to statistically analyze how risk exposure (referred to here as Exposure Index) and the use of Trend Micro’s MDR affect the rate of damage from cyberattacks. Based on the results, we explore from multiple perspectives what defines a proactive security posture and offer concrete recommendations on how organizations can prepare moving forward.
What is an SOC?
An SOC, or security operations center, is a dedicated team or facility inside an organization that monitors security, detects threats, and responds to incidents. A SOC operates 24/7, using tools like security information and event management (SIEM) to monitor system and network logs in real time. It works to detect signs of attacks early and respond quickly to reduce impact. SOCs play a central role in protecting the organization and strengthening its overall cybersecurity posture.
What is MDR?
Managed detection and response (MDR) is a service where an external expert team handles threat monitoring, detection, and incident response on behalf of the organization. MDR is used when it's difficult for an organization to run its own SOC or when additional expertise is needed to deal with advanced threats.
MDR is not the same as an SOC, but it provides similar capabilities — detecting and responding to threats — through an outsourced model. In this sense, MDR can be seen as an external version of an SOC. For more details on Trend Micro’s MDR services, please refer to the article, “Managed Detection and Response.”
What is Exposure Index?
Exposure Index is a score that shows how exposed an organization is to potential cyber threats. It is one of the sub-indices that make up the Cyber Risk Index, alongside the Attack Index and the Security Configuration Index. It is calculated based on factors like unpatched vulnerabilities, weak security settings, and systems that are accessible from the internet.
In Trend Micro’s CREM, the Exposure Index is measured on a scale from 0 to 100. A higher score means the organization has more exposure and is more likely to be targeted or exploited by attackers.
For more details on how this score is calculated and what factors are included, see the following resources:
In this study, we analyzed organizations using Trend Micro’s Extended Detection and Response (XDR) platform. These organizations were grouped based on whether they used Trend Micro’s MDR services and whether their Exposure Index scores were above or below the average.
We then calculated the percentage of organizations that experienced cyber incidents in each group to evaluate how MDR usage and exposure levels affect the likelihood of damage.
Target and Dataset
We used telemetry data collected through Trend Micro’s enterprise cybersecurity platform Trend Vision One™, specifically through XDR and CREM.
The dataset includes organizations that meet the following conditions:
- Organizations that used XDR and CREM throughout 2024
- Organizations that use all three sensors (endpoint, email, and network) throughout 2024
- Organizations with 500 – 10,000 employees (excluding smaller companies and very large enterprises)
- Organizations both with and without MDR services
We applied a sample restriction and limited the dataset to organizations with 500 – 10,000 employees to ensure consistent data quality and analytical comparability across groups.
Very small organizations often operate with simpler IT environments and fewer security resources, while very large enterprises tend to have more complex infrastructure and mature internal capabilities.
Including organizations at either extreme could introduce variability in system architecture, visibility, and response maturity — making it difficult to fairly compare risk factors across groups.
As a result of applying these conditions, the dataset includes 190 enterprise-level organizations from around the world that continuously used both XDR and CREM throughout 2024. Among them, organizations that consistently used MDR throughout 2024 are defined as “MDR users” in this analysis.
As shown in Figure 1, there are 92 organizations with MDR and 98 without MDR. Because the number of organizations in each group is nearly identical, the dataset provides a balanced foundation for comparison.

Figure 1. Organization count by MDR usage (n=190)
The regional distribution is roughly even across Europe, the Americas (North, Central, and South), and AMEA (Asia, Middle East, and Africa, including Japan).

Figure 2. Organization count by region (n=190)
The dataset is led by government/public services (33 organizations, 17.4%) and manufacturing (32 organizations, 16.8%), while no other industry exceeds 10% of the total.

Figure 3. Organization count by industry (n=190)
Defining Damage Incidents
We used XDR detection data to determine whether an organization experienced any type of damage. Each detection was mapped to a MITRE ATT&CK tactic.
We grouped the tactics into three attack phases:
- Preparation
- Execution
- Damage
If an organization had detections linked to TA0010 (Exfiltration) or TA0040 (Impact) during the analysis period, we considered it to have experienced actual damage.
| Attack Phase | MITRE ATT&CK Tactics |
|---|---|
| Preparation | TA0042 (Resource Development), TA0043 (Reconnaissance) |
| Execution | TA0001–TA0009, TA0011 (Initial Access through Command and Control) |
| Damage | TA0010 (Exfiltration), TA0040 (Impact) |
Table 1. Classification of attack phases based on MITRE ATT&CK Tactics
Analysis Methodology
This analysis focused on how two main factors affect the rate of damage:
- Whether or not the organization used MDR
- Whether the Exposure Index score was above or below the average (used as a threshold)
We created four groups based on these two variables (MDR usage and exposure level), and then calculated the percentage of organizations in each group that experienced damage.
To evaluate which group had the lowest risk, we used the following statistical indicators:
- Fisher’s Exact Test (significance tests). Although all expected cell counts exceed five — making the Chi-Square test statistically valid — we used Fisher’s Exact Test to obtain exact, conservative p-values. A Chi-Square test yielded similar results, confirming our conclusions
- Risk Ratio (RR)
- Risk Ratio 95% Confidence Interval (95% CI)
- Absolute Risk Reduction (ARR), also known as the risk difference between two groups (Risk Difference, RD); in this analysis, we consider exposure management and the use of MDR as “interventions” and therefore use the term to intuitively convey their effects
| INDICATOR | DESCRIPTION | USE CASE | HOW TO INTERPRET |
|---|---|---|---|
| Fisher’s Exact Test | A method to check if there is a relationship between two variables (categorical data). | Used to determine whether a difference is statistically significant. | p < 0.05 means the difference is statistically significant. |
| Risk Ratio (RR) | Compares how much more (or less) likely something is to happen in one group vs. another. | Used to show the difference in risk between two groups. | RR = 1: No difference RR > 1: Higher risk RR < 1: Lower risk |
| RR 95% Confidence Interval (95% CI) | Shows the range where the true RR is likely to fall (with 95% confidence). | Used to check if the RR is statistically reliable. | If the CI includes 1, the result may not be significant. Narrow CI = more reliable result. |
| Absolute Risk Reduction (ARR) | Shows how much the risk is reduced when using a certain method (as a percentage). ARR is calculated as the difference in damage rates between the two compared groups, expressed in percentage points. | Used to show the effectiveness of a measure. | ARR = 0 means no difference. The higher the ARR, the more effective the method. |
Table 2. Key statistical indicators for cyber risk analysis and how to interpret them
This chapter presents the results of a statistical analysis conducted to determine how factors such as the presence of MDR and the level of exposure index affect the actual risk of damage. We grouped and compared data from 190 organizations to uncover meaningful trends.
Summary of Aggregated Data
Table 3 and Table 4 show the aggregated data for each group and the statistical results of comparisons between them. As shown in Table 3, the average Exposure Index across all 190 organizations was 56.7.
In this analysis, this average value was used as the threshold to classify exposure levels: organizations with an Exposure Index score of 56.7 or higher were categorized as “high exposure,” while those with a score below 56.7 were categorized as “low exposure.” This split ensures even group sizes and clear interpretability across organizations.
Data Groups:
| GROUP# | GROUP | # OF ORGS | AVG. EXPOSURE INDEX | # WITH DAMAGE | DAMAGE RATE (RISK) |
|---|---|---|---|---|---|
| 1 | All | 190 | 56.7 | 71 | 37% |
| 2 | MDR | 92 | 56.9 | 30 | 33% |
| 3 | Non-MDR | 98 | 56.5 | 41 | 42% |
| 4 | Low Exposure | 89 | 53.2 | 18 | 20% |
| 5 | High Exposure | 101 | 59.8 | 53 | 52% |
| 6 | MDR + Low Exposure | 45 | 53.6 | 6 | 13% (Lowest) |
| 7 | Non-MDR + Low Exposure | 44 | 52.7 | 12 | 27% |
| 8 | MDR + High Exposure | 47 | 60.0 | 24 | 51% |
| 9 | Non-MDR + High Exposure | 54 | 59.7 | 29 | 54% (Highest) |
Table 3. Overview of group composition and damage occurrence
Group Comparisons and Statistical Results:
| NO. | GROUP COMPARISON | COMPARISON DETAILS | P-VALUE (Fisher’s) | RISK RATIO (RR) | RR 95% CI | ARR |
|---|---|---|---|---|---|---|
| 1 | 2 vs. 3 | MDR vs. Non-MDR | 0.230 | 0.78 | 0.54–1.13 | –0.092 |
| 2 | 4 vs. 5 | Low Exposure vs. High Exposure | <0.001 | 0.39 | 0.25–0.61 | –0.323 |
| 3 | 6 vs. 7 | MDR vs. Non-MDR (Low Exposure only) | 0.120 | 0.49 | 0.20–1.19 | –0.139 |
| 4 | 8 vs. 9 | MDR vs. Non-MDR (High Exposure only) | 0.843 | 0.95 | 0.65–1.38 | –0.026 |
| 5 | 6 vs. 8 | Low vs. High Exposure (MDR only) | <0.001 | 0.26 | 0.12–0.58 | –0.377 |
| 6 | 7 vs. 9 | Low vs. High Exposure (Non-MDR only) | 0.037 | 0.41 | 0.18–0.96 | –0.273 |
Table 4. Summary of statistical indicators across group (p-value, Risk Ratio, RR 95% CI, ARR)
Visualizing Trends in the Data
We then visualize the dataset and the statistical results to better understand what the data tells us.
First, we examine a histogram of the Exposure Index scores for all 190 organizations. The histogram shows a relatively normal distribution with a clear central peak and no significant skew or outliers. This validates the use of the mean as a meaningful threshold for exposure categorization. The average Exposure Index across all organizations was 56.7.
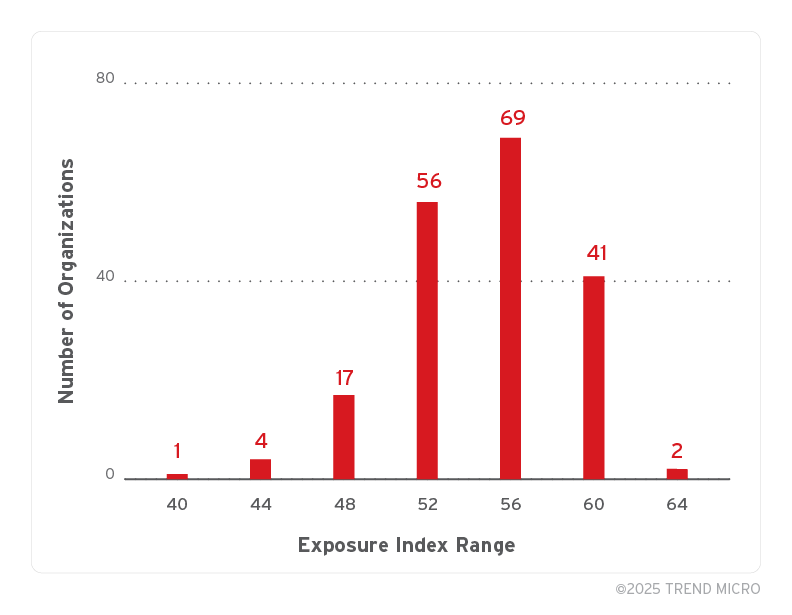
Figure 4. Distribution of Exposure Index (n=190)
Next, we look at the damage rate by exposure level — the percentage of organizations that experienced damage in each exposure range.
As shown in Figure 4, the number of organizations in each range is not uniform; the histogram illustrates the underlying sample distribution used to calculate the rates.
Despite this variation, the trend in Figure 5 clearly shows that as exposure increases, so does the likelihood of damage. This figure is intended to help visualize the overall relationship between exposure and risk, rather than to support direct statistical comparisons. Notably, even in lower exposure ranges, a number of organizations still experienced damage — indicating that low exposure does not eliminate risk entirely.
In total, 71 out of 190 organizations experienced damage, resulting in a damage rate of 37%.
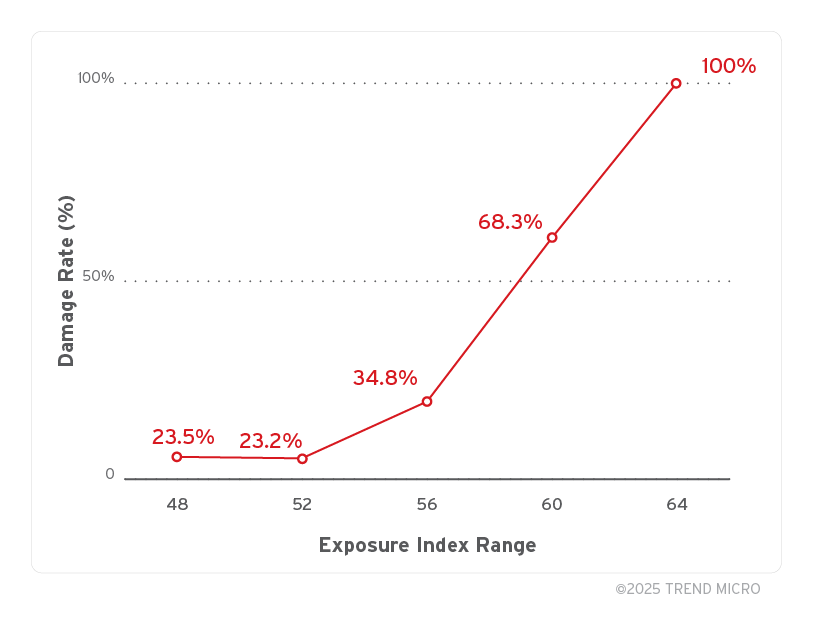
Figure 5. Relationship between Exposure Index and Damage Rate (n=190)
We then break down the damage rate by MDR usage and exposure level, visualized in a heatmap. The damage rate values shown in Table 3 are visualized in Figure 6 to better highlight differences across MDR and exposure groups.
The group with MDR + Low Exposure had the lowest damage rate at 13.3%, while the group with No MDR + High Exposure had the highest at 53.7%.
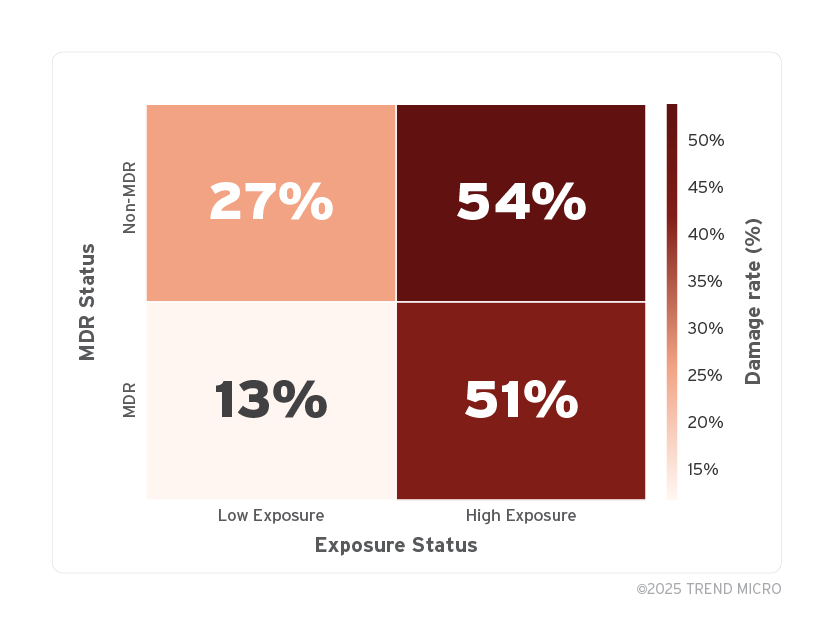
Figure 6. Damage rate by MDR and Exposure Status (n=190)
When comparing damage rates across groups, we observed noticeable differences based on exposure levels and the presence or absence of MDR. However, it’s essential to determine whether these differences are truly meaningful, that is, whether they are statistically significant. In cyber risk analysis, identifying the conditions under which damage is more likely to occur is critically important. To do so, we must assess whether the differences we see in the data reflect real underlying trends or are simply the result of random variation.
The key to making this judgment lies in checking for statistical significance. By confirming statistical significance, we can make several important decisions:
- Identify risk factors (Which attributes are strongly linked to actual damage?)
- Prioritize countermeasures (Where should resources be focused?)
- Support accountability and decision-making (What evidence can we present to stakeholders?)
Rather than relying on impressions or visual differences alone, making decisions based on statistical evidence leads to more effective and persuasive security strategies.
Now, let’s look at which group comparisons showed statistically meaningful differences, using a bar chart annotated with p-values. Generally, if the p-value is less than 0.05, it is interpreted as a statistically meaningful difference (statistically significant).
The results show that all differences related to high exposure were statistically significant (p < 0.05). In contrast, differences based on MDR usage were not statistically significant when exposure levels were high. This finding supports the conclusion that exposure level has a greater impact on damage rates than MDR usage alone.
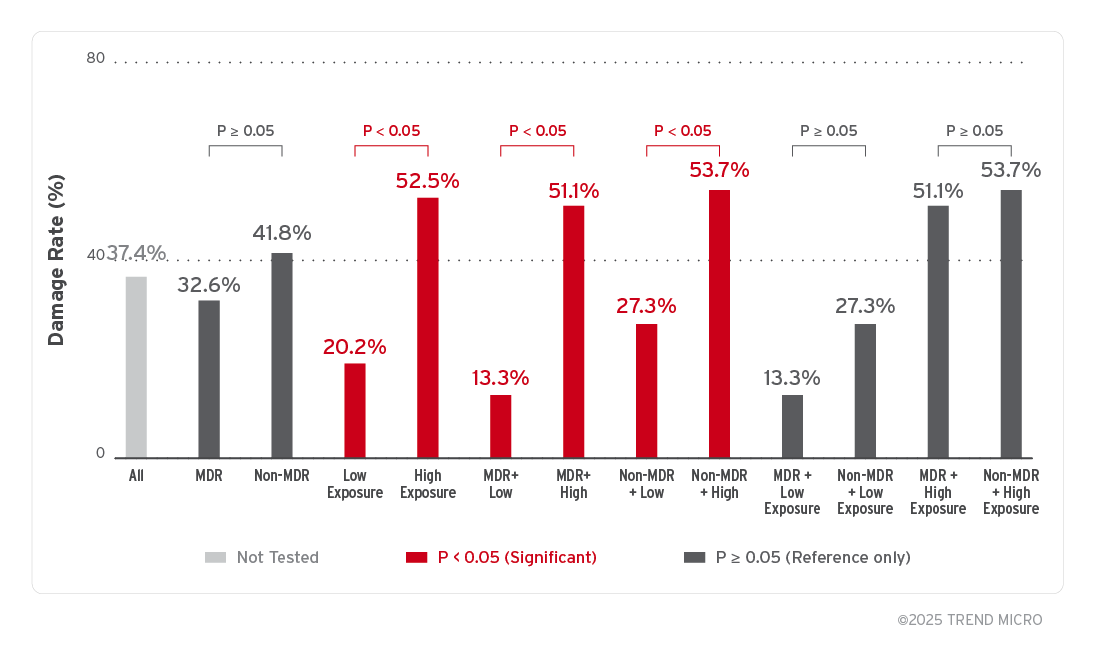
Figure 7. Damage Rate by group with p-value
To visualize how reliable the differences in risk are, we used a forest plot with Risk Ratios (RR) and their 95% Confidence Intervals (CIs).
Each point shows the estimated RR, and the horizontal line represents the 95% CI. The “95% Confidence Interval (CI)” means:
“If we repeated this analysis many times, the true value would fall inside this range in 95 out of 100 times.”
If this line crosses 1.0 (the vertical dashed red line), it means the difference could be due to random chance and might not be statistically significant.
From this figure, we can observe the following:
- In low-exposure environments (Groups 2, 5, and 6), all risk ratios (RRs) are below 1.0, and their confidence intervals do not cross 1.0. This confirms that low exposure clearly contributes to risk reduction.
- The effectiveness of MDR (Groups 1 and 3) also shows RRs below 1.0 in low-exposure environments, indicating a trend toward reduced risk. However, since the confidence intervals include 1.0, the differences are not statistically significant, and more data is needed to confirm the effect. In contrast, in high-exposure environments (Group 4), MDR showed minimal impact, suggesting a limited contribution to risk reduction under such conditions.

Figure 8. Risk ratio with 95% confidence intervals by comparison group
To compare the effect of risk reduction, we visualized the ARR across six different conditions using a bar chart.
ARR represents how much the risk — measured in percentage points — decreases depending on whether a countermeasure is applied or not.
The ARR values shown in Table 4 are visualized in Figure 9 to highlight differences in ARR across group comparisons.
One noteworthy finding is observed in Group 5, where the Exposure Index was reduced from high to low in an MDR-enabled environment.
In this condition, the risk of experiencing damage decreased by about 38 percentage points, calculated as the absolute difference in damage rates between Group 8 (51%) and Group 6 (13%) — marking the most significant risk reduction effect among all comparisons.
This result strongly suggests that exposure management within MDR-enabled environments plays a critical role in minimizing cyber risk.
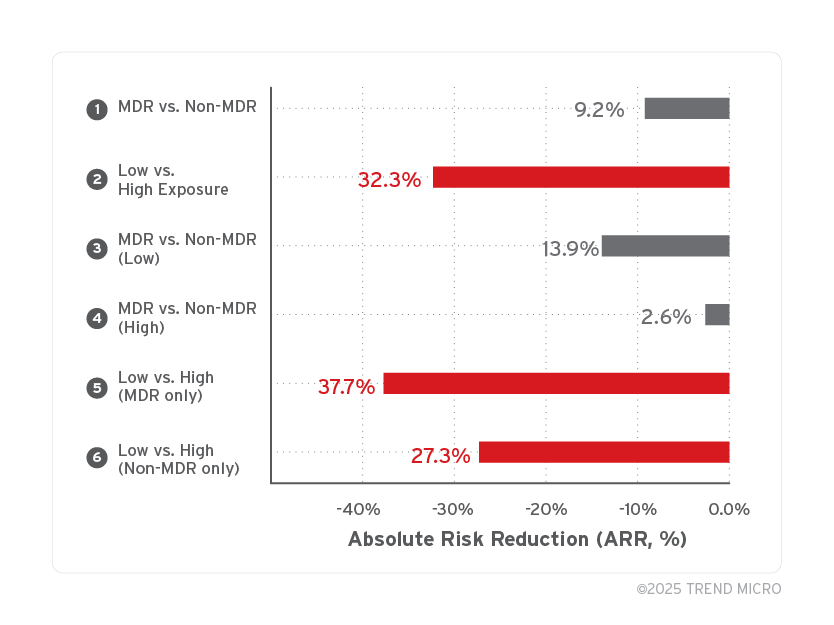
Figure 9. ARR by comparison group
As an interpretation of results based on this analysis, we have identified three key factors related to the risk of experiencing damage from cyber incidents:
- Higher exposure significantly increases the risk of damage
- MDR appears to be more effective when combined with exposure management
- The most secure setup was found in organizations that combined MDR with low exposure
Higher exposure significantly increases the risk of damage
The data clearly shows that organizations with high exposure had a much higher rate of damage. For example, Table 3 showed that organizations in the High Exposure group (Group 5) had a damage rate of 52%, while those in the Low Exposure group (Group 4) had a rate of 20%. This corresponds to a relative risk of 2.6 times higher for high-exposure organizations. This is likely because in high-exposure environments, attackers can more easily find entry points, and the time from intrusion to impact is shorter — resulting in a higher likelihood of actual damage.
MDR appears to be more effective when combined with exposure management
On the other hand, MDR alone is not a definitive solution for reducing risk. There are several possible reasons for this:
- Organizations frequently targeted by APT attacks — such as government agencies — are more likely to adopt MDR, but their high baseline damage rates can mask the improvements that MDR provides.
- The effectiveness of MDR depends heavily on how quickly and accurately organizations can respond after detection.
- Some non-MDR organizations might already have mature internal security operations, which is why they do not use MDR services.
With that said, a general trend toward lower incident rates is observed among organizations using MDR. While this trend is not statistically significant, it suggests a potential effect worth considering, especially in combination with exposure management.
The most secure setup is found in organizations that combined MDR with low exposure
The group combining MDR with low exposure had the lowest damage rate among all configurations analyzed — just 13.3% (six out of 45 organizations). This finding is supported by the aggregated data in Table 3 and the visual breakdown in Figure 6.
By using MDR, organizations can detect threats during the early stages (preparation and execution) and respond quickly before damage occurs. However, if exposure remains high, attacks tend to progress faster, and even timely detection might not be enough to prevent impact.
In contrast, in low-exposure environments, not only is the success rate of attacks reduced, but even if an attack occurs, its progression tends to be slower, giving defenders more time to respond. As a result, MDR is more effective in these scenarios, and damage rates are noticeably lower.
MDR has an indispensable role
Even in organizations with both MDR and low exposure, risk is not entirely eliminated — the observed damage rate was 13.3% (6 out of 45 organizations). Some types of attacks are considered difficult to prevent even with good risk management. These include:
- Zero-day attacks that exploit unknown vulnerabilities
- Insider threats, such as misuse or intentional harm by internal actors.
- Advanced persistent threats (APTs) that target specific organizations and persist until successful.
While such attacks might be difficult to prevent entirely, MDR plays a key role in limiting their impact. Its value lies in two core capabilities:
- Even when an attack occurs, MDR enables faster detection and response, helping prevent damage from happening in the first place.
- If damage does occur, MDR helps minimize the scope and severity of that impact.
For example, if there is data theft (exfiltration) or other harmful activities (impact), organizations using MDR are generally able to respond more quickly and stop the situation before it gets worse.
Limitations and Future Work
While this analysis provides valuable insights into how MDR usage and exposure levels influence the likelihood of cyber damage, several important areas remain for future study and analysis. Understanding these limitations not only helps interpret the results appropriately but also points to directions where further research can deepen our understanding and strengthen proactive strategies.
- Static exposure and damage states. We treated each organization’s Exposure Index and any Exfiltration/Impact event over 2024 as fixed annual conditions, so we cannot confirm that specific detections occurred after the measured exposure.
- Single-event labeling. An organization was labeled “damaged” if it had one or more XDR detections of the Exfiltration or Impact event, regardless of how often or how severe those events were.
- Binary exposure classification. Exposure Index values were dichotomized into “high” or “low” based on the annual average and overall mean, which could obscure subtle variations near the threshold.
- Uncontrolled confounders. We did not adjust for other factors, such as industry, region, or company size, that could influence both exposure and the likelihood of damage.
- Size metric limitation. While asset count could serve as a more direct measure of organizational size, we used employee count as a practical proxy due to its consistency and availability in our dataset.
- Limited labeling. Our “damage” labeling consists solely of Exfiltration and Impact XDR events, so MDR’s effect on reducing the severity or scope of damage is not captured.
- Sample scope and generalizability. The dataset covers 190 organizations using Trend Micro XDR and CREM throughout 2024; results might not generalize to other environments, products, or time periods.
Building on these limitations, future research could strengthen the findings and uncover additional patterns:
- Expand sample size and diversity. Increasing the number of organizations in each group (e.g., MDR + Low Exposure) would improve statistical power and allow for more reliable detection of weaker effects. Including a broader range of industries, regions, and organizational sizes would also enable deeper stratified analysis.
- Introduce time-series and longitudinal analysis. Tracking exposure and incident activity over time could uncover more accurate cause-and-effect relationships, helping determine whether improvements in exposure scores lead to fewer incidents.
- Evaluate human and process factors. Future studies should explore how organizational factors — such as incident response readiness, executive engagement, or security awareness — interact with exposure and MDR to influence outcomes.
- Compare across platforms. By replicating this analysis using different detection and risk-scoring systems, researchers could validate whether the observed trends hold across tools and environments.
Although this study has its constraints, the core message remains clear: Managing cyber risk exposure is essential, and MDR becomes most effective when paired with a reduced attack surface. Future work can help refine these insights and guide the development of more adaptive, proactive defense strategies.
In the previous chapters, we examined how differences in exposure levels and the use of MDR affect the likelihood of damage. The results showed that high exposure levels have a statistically significant impact on damage occurrence. While the use of MDR did not demonstrate statistical significance on its own, the analysis suggests that combining MDR with a low-exposure environment can help reduce the likelihood of damage.
Based on these insights, we explore how organizations can build a proactive security posture in this chapter. This is organized around four key perspectives:
- Proactive actions to control risk
- Proactive preparation for incident response
- Fostering a culture and structure that support proactive capability
- Strengthening proactive capability through collaboration with external experts
These efforts go beyond technical responses. They help develop an organization’s “proactive capability” — the ability to actively and flexibly adapt to cyber risks — and contribute to long-term resilience.
Proactive Actions to Control Risk
To reduce cyber risk, organizations must first identify where the risk lies. As this analysis shows, the level of exposure — whether high or low — has a significant impact on the likelihood of damage. More importantly, exposure is not a fixed attribute, but a measurable factor that can be managed and improved through continuous visibility and mitigation
CREM plays a critical role here. By identifying vulnerabilities, misconfigurations, and unnecessarily exposed assets, organizations can visualize and prioritize risks and systematically reduce exposure.
| PROACTIVE MEASURE | Example Actions |
|---|---|
| Quantify Risk Visually | Use exposure scores and vulnerability metrics to quantify risk and monitor changes continuously |
| Prioritize Based On Business Impact | Select remediation targets based on business impact to allocate resources efficiently |
| Support Executive Decision-Making | Visualize risk scores and trends to inform executive meetings and guide decisions on mitigation and investment |
| Institutionalize Risk Reduction | Embed regular risk assessments and improvement cycles into business operations to manage exposure continuously |
Table 5. Proactive risk reduction measures and sample actions
Proactive Preparation for Incidents
Incident response might appear reactive, but preparing in advance for what-if scenarios is itself a proactive effort. In particular, shortening the time from detection to response and recovery requires thorough preparation.
This includes building detection rules tailored to expected threats, optimizing EDR/XDR, developing and training on incident response procedures, and clearly defining decision-making flows — including executive involvement. These preparations enable the entire organization to respond swiftly when an incident occurs.
| PROACTIVE MEASURE | Example Actions |
|---|---|
| Prepare for Rapid Detection | Develop detection rules based on attack patterns and optimize EDR/XDR systems. |
| Establish and Train Response Procedures | Create playbooks and conduct regular tabletop exercises and simulations. |
| Clarify Executive Decision-Making Flows | Design and share escalation and decision processes for critical incidents across the organization. |
| Prepare for Containment and Recovery | Build segmentation strategies and backup systems to limit damage and enable early recovery. |
Table 6. Proactive preparedness for incidents and sample actions
Fostering a Culture and Structure for Proactive Capability
To ensure that proactive efforts become ingrained and sustained within the organization, a supportive culture and structure are essential. We introduce the concept of “Proactive Capability” as a core framework and break down its components as follows:
| COMPONENT | Description |
|---|---|
| Adaptive Readiness | The ability to revise rules and strategies based on evolving threats and technologies, and continuously evolve |
| Iterative Defense | A mindset that reflects continuous learning into improved processes and countermeasures |
| Cross-Functional Coordination | A structure that enables fast decision-making and action through collaboration with executive, legal, PR, and other departments |
Table 7. Three components of Proactive Capability
These components form the foundation for evolving from a reactive to a proactive security posture. By cultivating them as part of the organization’s culture, companies can enhance resilience and respond flexibly to unpredictable future threats.
Strengthening Proactive Capability Through Collaboration With External Experts
Building a proactive security posture requires not only technical expertise but also coordination across the organization for visibility, prioritization, and executive decision-making support.
However, not every organization has the internal resources to fulfill these requirements. Some face challenges, such as:
- Lacking an objective understanding of their risk profile.
- Having limited in-house expertise in risk evaluation and prioritization.
- Needing better tools and methods for communicating with executives.
In such cases, collaborating with external experts becomes a powerful and realistic option. One effective approach is to leverage advisory-based services. A prime example is Cyber Risk Advisory Services (CRAS), which uses CREM data to support visualization, evaluation, prioritization, and strategic planning. Services like CRAS help organizations take their first strategic and confident steps toward a proactive posture.
By incorporating external insights and expertise, organizations can accelerate the development of their proactive capabilities and move toward a more resilient and forward-looking cybersecurity strategy.
This report examined how cyber risk exposure and the use of MDR influence the likelihood of damage, based on real-world data from 190 enterprise organizations. Through this analysis, we explored the question: What constitutes a proactive security posture?
Based on the findings, a proactive security posture can be structured around the following three core components:
1. Visualization and control of risk
Continuously visualize risks, such as unpatched vulnerabilities or misconfigurations, and systematically reduce them by prioritizing based on business impact.
2. Readiness for detection and response
Assume that incidents will occur and prepare systems that can detect and respond quickly to minimize damage.
3. An integrated operational foundation and culture
Ensure that risk management and incident response are connected, and embed a continuous improvement cycle into both operations and organizational culture.
Of course, not all organizations can establish this type of structure all at once. However, by using tools such as CREM to visualize risk and leveraging external support like CRAS, it is entirely possible to gradually build a proactive security posture that is realistic and actionable for each organization.
A proactive security posture is not about predicting the future with precision — it is a framework for standardizing the ability to prepare for the unpredictable. Embedding the mindset of “preparing before something happens” into the organizational culture can be seen as the first true step toward achieving cyber resilience.
Building a strong security posture shares more in common with maintaining good health than you might think.
To stay healthy, we adopt everyday habits — washing our hands, eating well, getting enough sleep, and staying active. These help us stay ahead of invisible threats before they strike. Cybersecurity is no different. By preparing for unseen threats, we build a safer tomorrow.
Just like with our health, preparation is the most important step in cybersecurity. Why? Because once something goes wrong, it’s already too late. That’s why early risk detection, proactive habits, and rapid response systems are essential for both.
Health checkups help us visualize our current condition and detect early signs of risk. Without them, we wouldn’t even know where to begin improving our lifestyle. This is much like CREM, which helps organizations see and measure their exposure. You can’t improve what you can’t see.
To prevent illness, we integrate a range of proactive practices into our daily routines — hygiene practices, eating better, exercising more, and getting vaccinated. In cybersecurity, we do the same with Endpoint Protection Platform (EPP) for blocking known malware. Beyond that, reviewing security configurations, educating users, and promoting safe usage habits all contribute to prevention. These practices might be quiet, but they drastically lower the chance of infection and preserve normal operations.
Still, when we fall sick or get injured, we rely on hospitals and emergency services. Similarly, when a cyberattack strikes, MDR plays a critical role in ensuring resilience. Rapid response is crucial for containing ransomware, analyzing logs, conducting forensics, and understanding the scope of impact.
When chronic health issues or complex symptoms arise, we often need help. We turn to doctors for expert advice and long-term planning. Likewise, in cybersecurity, having trusted partners matters. CRAS offers expert support for strategy and decision-making — especially when things get too complicated to handle alone.
Health and cybersecurity share a simple truth: daily actions shape future outcomes.
| COMPONENT | Description | Description |
|---|---|---|
| Regular health checkups | Visualize risks | CREM (quantify and visualize cyber risk exposure) |
| Daily preventive actions (e.g., handwashing, eating well) | Build resistance and prevent illness | EPP/security configuration/ user education |
| Emergency care for illness or injury | Rapid response during incidents | MDR (detection, response, and containment) |
| Consultation with medical specialists | Expert advice for complex cases | CRAS (strategic guidance and long-term cyber risk planning) |
Table 8. Four habits that protect us: Health and cyber security
Proactive Security Starts Here
If you’ve stayed healthy without visiting a doctor or getting sick, it’s not just luck — it’s the result of your habits and preparation. The same goes for cybersecurity. “Nothing happened” is the best possible outcome — and it’s not accidental. It’s the product of consistent preparation and awareness.
Just like with your health, improving your organization’s cybersecurity posture takes time. That’s why it’s crucial to start now. As discussed in Chapter 4, proactive capability is something that develops gradually — through behavior, decision-making, training, and leadership.
This makes “now” — when nothing has happened yet — the perfect time to build a proactive culture and strengthen your organizational resilience.
Step forward today to protect your future. Each small decision builds toward greater peace of mind. Begin your journey with these first actions:
Like it? Add this infographic to your site:
1. Click on the box below. 2. Press Ctrl+A to select all. 3. Press Ctrl+C to copy. 4. Paste the code into your page (Ctrl+V).
Image will appear the same size as you see above.
Recent Posts
- TrendAI™ 2026 Cyber Risk Report
- The Hidden Risk in Your AI Rollout: Your Endpoints
- When AI Becomes a Zero-Day Machine: What Public Sector Organizations Need to Know
- A Data-Driven View of Cyber Risk Structure: How Attack Pressure and Exposure Shape Damage
- Hunt Them All: An AI-Powered Vulnerability Sweep of 19,000 MCP Servers
 Fault Lines in the AI Ecosystem: TrendAI™ State of AI Security Report
 It’s By Design: The Use-After-Free of Azure Cloud
 TrendAI™ 2026 Cyber Risk Report
 Guarding LLMs With a Layered Prompt Injection Representation