A Data-Driven View of Cyber Risk Structure: How Attack Pressure and Exposure Shape Damage
A Data-Driven View of Cyber Risk Structure:
How Attack Pressure and Exposure Shape Damage
 Download the PDF
TrendAI™ Research studied the unique interaction of attack pressure and exposure and how they shape damage experienced by organizations. Since TrendAI™ introduced the Cyber Risk Index (CRI), real-world environments with similar CRI values have been observed to experience very different damage outcomes, and this analysis uncovers the factors that drive that difference.
The research analyzed telemetry from 2,014 enterprises worldwide that continuously used TrendAI Vision One™ Cyber Risk Exposure Management (CREM) and extended detection and response (XDR) platforms throughout 2025. The study found that cyber damage is not determined by the number of vulnerabilities or the volume of attacks alone, but rather the combination of:
- The level of Attack Pressure an organization faced
- The Exposure conditions it had
- The effectiveness with which harmful activity appeared to be detected, responded to, and constrained once attacks occurred
Attack Index
represents the overall level of observed attack intensity an organization faced during the study period, calculated from the types and volume of attack-related events.
Exposure Index
represents organizational exposure based on vulnerabilities, misconfigurations, and externally exposed services.
Damage Months
counts the number of months in which later-stage MITRE ATT&CK™ tactics, specifically TA0010 (Exfiltration) and TA0040 (Impact), were observed in XDR telemetry.
It should be noted that Damage Months does not directly measure financial loss or operational disruption. It serves as a proxy for the persistence of damage-related activity over time. For all three metrics, the study used the annual average per organization.
The broader relationship becomes easier to interpret through the Cyber Risk Positioning Map introduced in the research. Rather than focusing only on overall risk scores, the map helps visualize how Attack Pressure, Exposure, and apparent damage containment may interact across different organizational environments.
Download the PDF to learn more about how attack pressure and exposure shape damage.
This study builds on two earlier publications by TrendAI™ Research. The December 2024 report, From Vulnerable to Resilient: Cutting Ransomware Risk with Proactive Cyber Risk Exposure Management, established the importance of continuously reducing exposure-related risk through CREM. The July 2025 report, Proactive Security: The Role of Exposure Management and Detection & Response Capability, argued that exposure management and detection and response should be evaluated together when assessing organizational cyber risk. The present study extends both lines of work into a single analytical framework, adding attack pressure as a third variable and examining how all three interact in observed telemetry.
The analysis found that the impact of Exposure did not appear evenly across all conditions. Organizations with low Attack Pressure and low Exposure averaged approximately 2.9 Damage Months. Meanwhile, organizations with high Attack Pressure and high Exposure averaged approximately 9.6 Damage Months, representing up to a 3.3-fold difference.
Even under similarly high Attack Pressure conditions, organizations with lower Exposure still showed roughly 30% fewer Damage Months than organizations with higher Exposure.
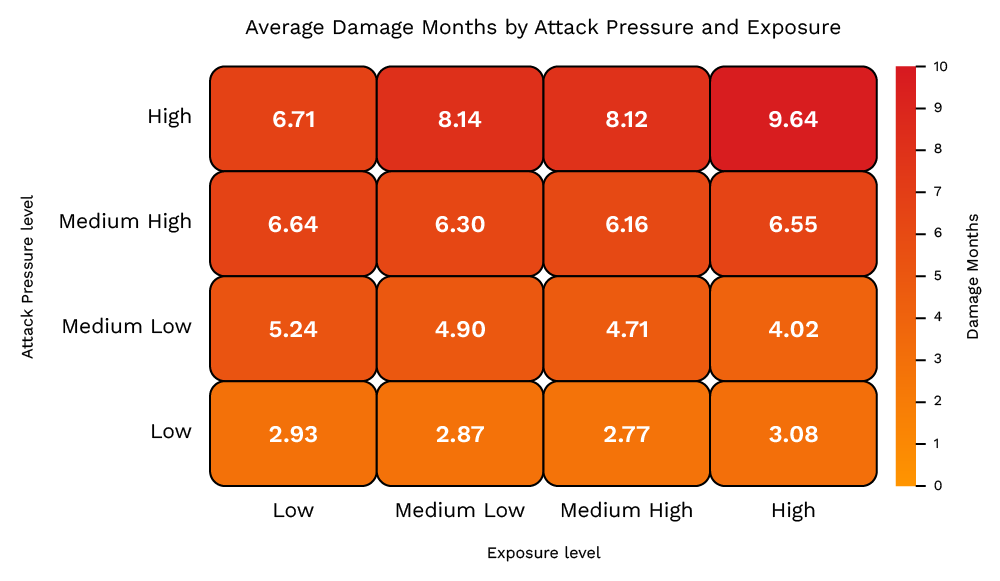
Figure 1. Average Damage Months by Attack Pressure and Exposure
This suggests that Exposure management may be more than simply improving a risk score. In higher-pressure environments, reducing Exposure itself may help limit how far attacks are able to progress and how long harmful activity persists. This can include:
- Reducing unnecessary internet-facing exposure
- Continuously addressing vulnerabilities and misconfigurations
- Improving asset visibility
- Prioritizing remediation activities based on risk
The findings support the idea that Exposure management is not only a visibility exercise, but also a proactive security activity that can influence downstream outcomes.
Under lower Attack Pressure, differences in Exposure corresponded to relatively small differences in damage. Under higher Attack Pressure, the separation widened considerably. Exposure becomes a materially more important factor precisely when the attack environment is already harsh.
The analysis also showed that Attack Pressure had the strongest overall relationship with Damage. However, organizations operating under similar Attack Pressure conditions still showed substantial variation in Damage outcomes, which means there were some organizations facing intense Attack Pressure that still appeared to constrain damage relatively effectively.
This suggests that cyber damage may not be determined by attack volume alone and that Detection & Response Capability also plays a meaningful role in shaping outcomes.
To help organize this relationship, TrendAI™ Research introduced a Cyber Risk Positioning Map that combines the Cyber Risk Index (CRI) with a supplementary Detection & Response Capability Score. Note that this is not a predictive model but rather a practical framework for understanding why organizations in similar attack environments could still experience different results, and where to focus security investment priorities.
To examine how these relationships appear at a sector level, organizations were classified into six broader industry groups, and an industry cyber risk landscape was constructed using the mean values of Attack Index, Exposure Index, and Damage Months for each group.
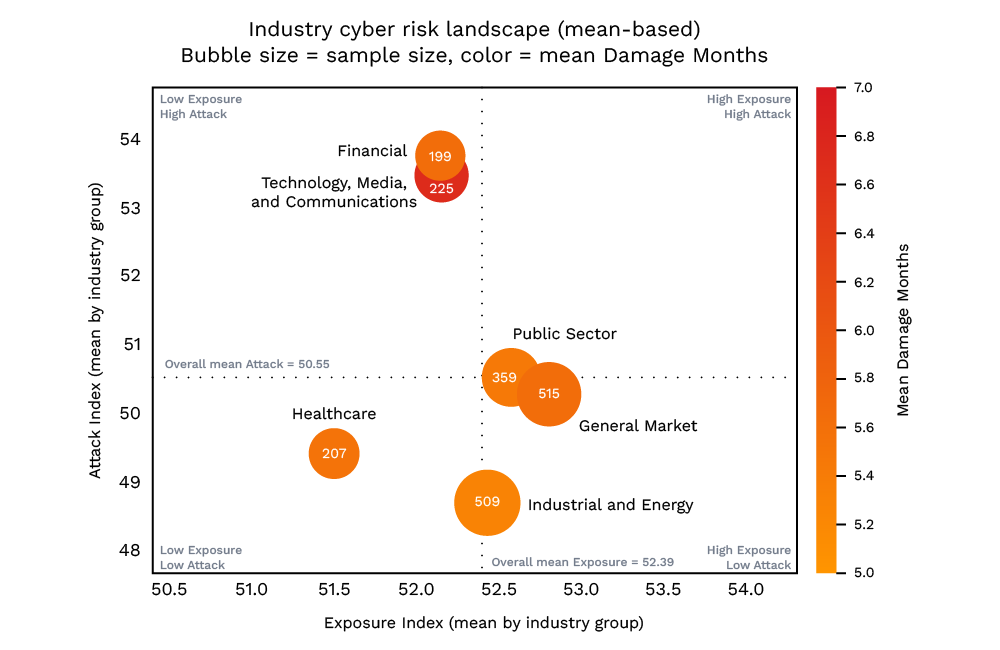
Figure 2. The industry cyber risk landscape
The analysis showed meaningful differences in attack environments across industries, with Financial organizations and Technology, Media, and Communications organizations showing relatively high average Attack Pressure compared to other sectors.
Industry averages alone were not enough to explain actual organizational risk, as organizations within the same industry still showed wide variation in Attack Pressure, Exposure, and Damage outcomes. Industry context is useful for understanding broad tendencies, but it does not fully determine the risk faced by any individual organization.
More information on these groups can be found in the PDF.
Three operational principles follow from the data.
- CRI becomes more actionable when interpreted together with Attack Pressure, Exposure, and the extent to which harmful activity can be constrained in practice.
- The combination of Attack Pressure and Exposure is more informative than either factor alone. The same exposure level carries different practical weight depending on the surrounding attack environment.
- Risk reduction requires action on two fronts. The first is reducing the conditions that make initial compromise more likely (vulnerabilities, misconfigurations, unnecessary surface area). The second is strengthening the ability to detect, investigate, and contain harmful activity before it develops into persistent damage.
Looking at the three principles through a driving analogy:
Attack Pressure
External road conditions (heavy rain, icy roads, poor visibility, or dense traffic)
Exposure
Vehicle weaknesses (worn tires, weak brakes, or faulty headlights)
Detection & Response
The ability to spot danger early, react quickly, and regain control
Driving through dangerous conditions does not automatically lead to an accident, but when harsh external conditions, vehicle weaknesses, and poor reaction capability combine, the likelihood of serious outcomes increases significantly.
Industry differences may also resemble different types of vehicles operating under different road conditions. A sports car, SUV, and heavy truck can face the same highway differently just as different industries face different operational realities, exposure conditions, and response challenges even when operating in broadly similar environments.
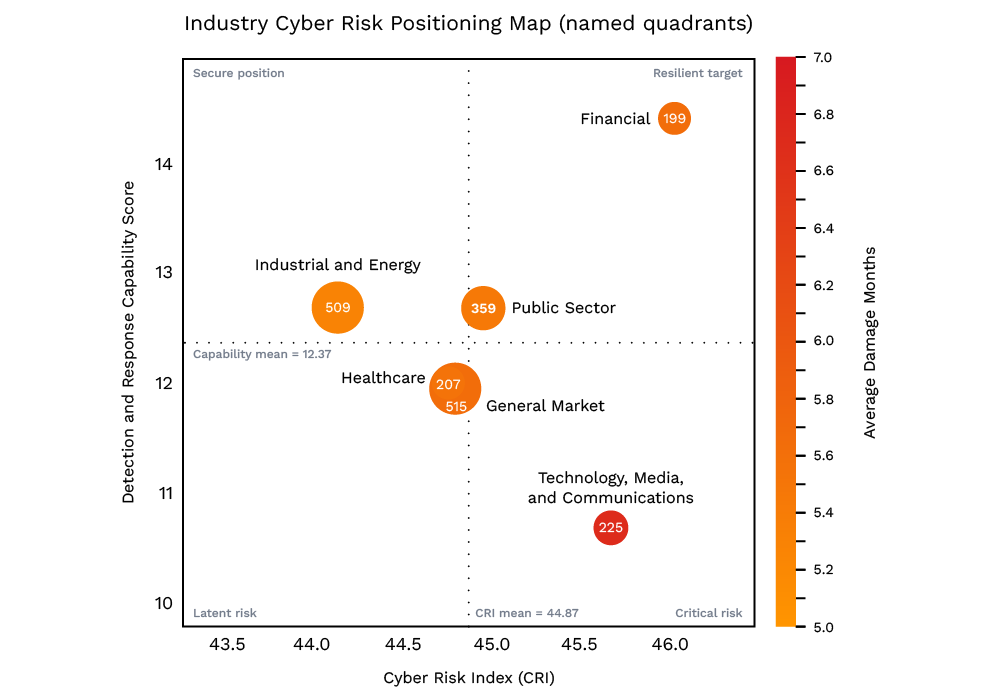
Figure 3. The Industry Cyber Risk Positioning Map.
Note: The numbers in each circle specify the sample size for each industry group.
In the Cyber Risk Positioning Map, organizations operating under different combinations of Attack Pressure, Exposure, and apparent damage containment can still occupy very different positions even when overall risk scores appear similar.
The map introduces an additional perspective by combining the CRI with the Detection & Response Capability Score to make it easier to visualize how severe the surrounding risk environment can be and how effectively harmful activity appears to be constrained in practice. The map provides a more operational and actionable way to interpret organizational risk conditions that can help organizations better understand how to improve their efforts:
- Organizations positioned toward the right side should focus on reducing exposure and understanding which external conditions drive their elevated CRI.
- Organizations positioned lower on the vertical axis should examine whether harmful activity is being constrained effectively relative to their Attack Pressure.
- Organizations in the lower-right corner should prioritize both simultaneously.
Over time, organizations can reassess their position as telemetry changes to track whether they are moving toward a more favorable risk structure or remaining static.
One of the broader implications of this study is that the CRI becomes more actionable when organizations understand the underlying conditions contributing to it. What matters is not only the overall risk score, but also:
- The level of Attack Pressure surrounding the organization
- The Exposure conditions that may amplify risk
- The effectiveness with which harmful activity appears to be constrained
Industry context also proved useful for identifying broad tendencies in the attack environment, but substantial variation within the same industry confirmed that actual cyber risk is formed at the organizational level. We recommend that enterprises maximize TrendAI Vision One™ solutions to understand their cyber risk through the lens of Attack Pressure, Exposure, and Detection & Response Capability to better determine:
- Whether Exposure reduction should be prioritized.
- Whether Detection & Response Capability requires additional investment.
- Whether both need to be strengthened together.
By viewing the CRI through this broader operational context, organizations may be better positioned to make clearer and more practical cyber risk decisions.
Like it? Add this infographic to your site:
1. Click on the box below. 2. Press Ctrl+A to select all. 3. Press Ctrl+C to copy. 4. Paste the code into your page (Ctrl+V).
Image will appear the same size as you see above.
 Fault Lines in the AI Ecosystem: TrendAI™ State of AI Security Report
 It’s By Design: The Use-After-Free of Azure Cloud
 TrendAI™ 2026 Cyber Risk Report
 Guarding LLMs With a Layered Prompt Injection Representation