Observability Exposed: Exploring Risks in Cloud-Native Metrics
By Nitesh Surana
Container Advisor (cAdvisor) is an open-source monitoring tool for containers that is widely used in cloud services. It logs and monitors metrics like network I/O, disk I/O, and CPU usage. However, misconfigured deployments might inadvertently expose sensitive information, including environment variables such as Prometheus metrics. In this blog entry, we share our findings of the risks we have uncovered and the vulnerable configurations users need to be aware of.
Introduction
Like all environments, cloud-native environments require constant monitoring of deployed services, especially because of their complex and ephemeral nature. Observability is the ability to gauge a system’s current state at a point in time based on the data generated, such as logs, metrics, and traces. Metrics play a very important role, especially for site reliability engineers (SREs) and security operations (SecOps) teams in figuring out the “what and when” information of activities within their environments.
According to the Cloud Native Computing Foundation (CNCF), monitoring “includes everything from watching disk space, CPU usage, and memory consumption on individual nodes to doing detailed synthetic transactions to see if a system or application is responding correctly and in a timely manner.”
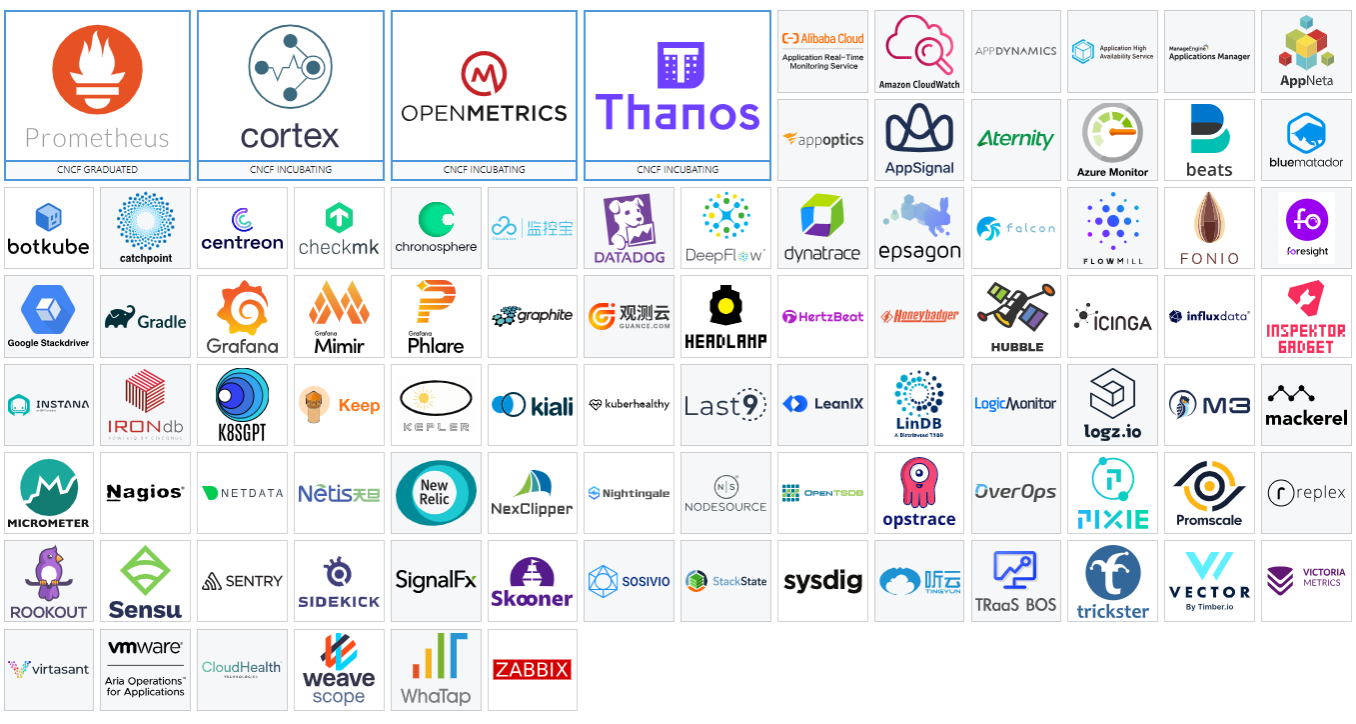
Figure 1. Projects related to monitoring cloud native environments within the CNCF landscape
Prometheus is a CNCF graduated project that collects metrics from environments at given intervals, evaluates rule expressions, displays results, and triggers alerts when specified conditions are observed. Metrics play an important role in understanding why an application is working a certain way.
Let's assume that you are running a web application and notice that it is running slowly. To discover what is happening with your application, you will need some information. For example, the application might run slowly if there is a high number of requests. If you have the request count metric, you can determine if the reason for the slow application performance is a high number of requests and increase the number of servers to handle the load.
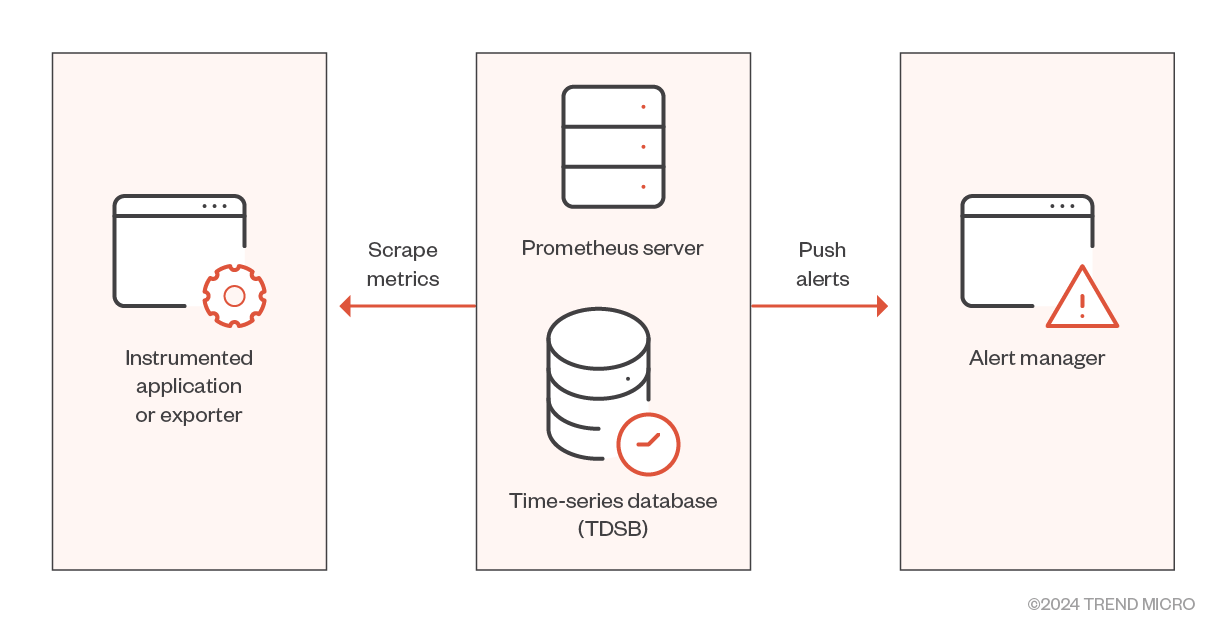
Figure 2. Prometheus’ architecture
Source: Prometheus
In Figure 2, we can see that Prometheus scrapes metrics from Prometheus targets that consist of jobs and exporters. Exporters are libraries and servers that help in exporting existing metrics from third-party systems such as Prometheus metrics. Prometheus supports over 200 exporters, spanning across databases, hardware, issue trackers, messaging systems, storage, HTTP servers, APIs, and logging solutions. The scraped data is processed by a set of rules to trigger alerts. Additionally, one can query and visualize this processed data using a web user interface (UI) and projects like Grafana.
The exporters expose the metrics on a specific endpoint “/metrics” and ports, which are also well documented on Prometheus’ official GitHub wiki. These metrics are generally assumed to contain benign information about an environment.
As stated in the Prometheus Security guidelines, metrics are not considered to be a secret. Additionally, pen tests conducted by Cure53 in 2018 had identified this exposure as PRM-01-002, which the Prometheus team considered as an expected behavior. In 2022, researchers from Sysdig investigated the risks of exposed Prometheus’ instances. Since then, the community has been aware of the risks of exposing Prometheus dashboards to the internet. However, if the metrics endpoint from an exporter itself is exposed, what could attackers possibly do? In 2016, a security blog discussed how open ports can widen the network attack surface of cAdvisor. In this blog entry, we'll examine the potential risks of vulnerable cAdvisor configurations that users need to be aware of.
Brief overview of cAdvisor
cAdvisor, which is short for Container Advisor, is a Google-developed open-source container-monitoring tool written in Golang. It runs as a daemon that collects, aggregates, processes, and exports information about running containers. Based on public information and our findings, cAdvisor is used in (but not limited to) Kubelets, Azure Machine Learning service, and AKS, as well as across various other services where container monitoring is needed.
Users can either follow the official Prometheus guide to set up a monitoring solution for Docker containers using cAdvisor or run it as a standalone binary on their Linux host. In this section, we will examine exposed cAdvisor endpoints. When run in a default configuration, cAdvisor exposes the following information on port 8080:
Web UI
Users can access the web UI on port 8080. Specifically for cAdvisor, the web UI looks like this:
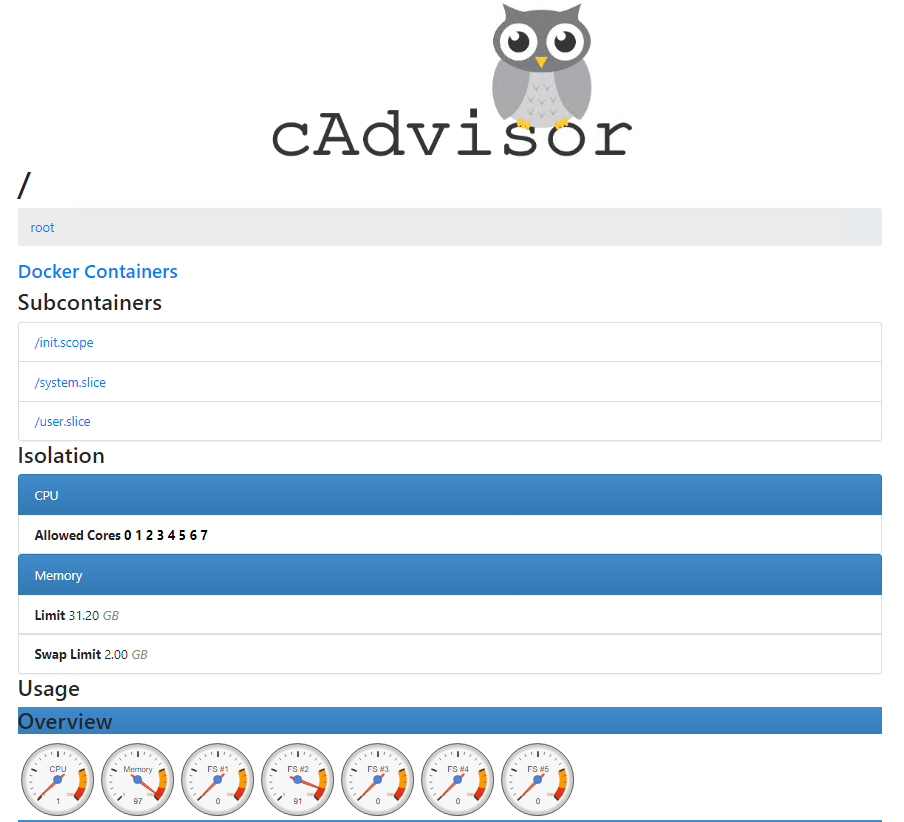
Figure 3. cAdvisor web UI on port 8080
The web UI exposes the following information:
- Memory limits per cgroup
- Output of “ps” command in each cgroup
- Real-time CPU usage
- Real-time network I/O
- Real-time file system usage
- Docker version
- Docker API version
- Kernel version
- Operating system version
- Host name
- List of all container images
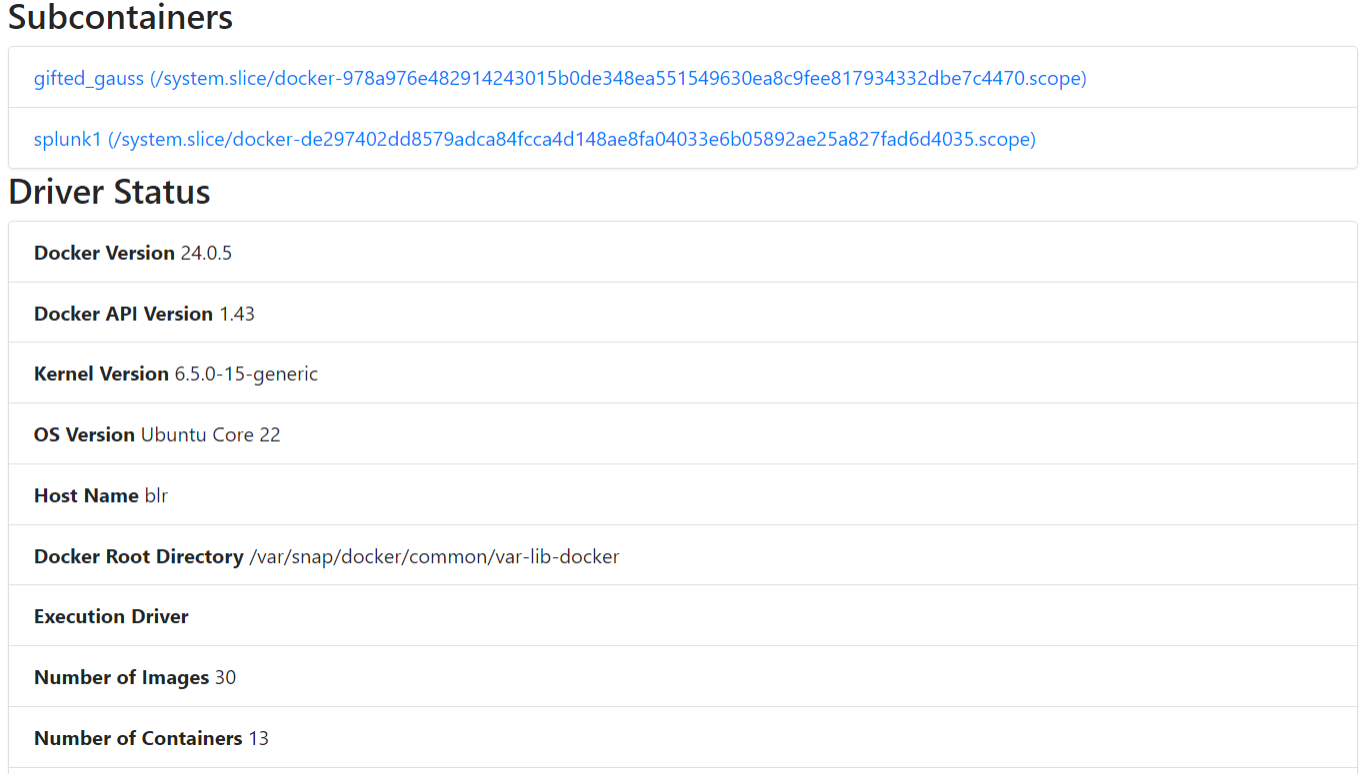
Figure 4. List of Docker containers and host information as seen on the web UI
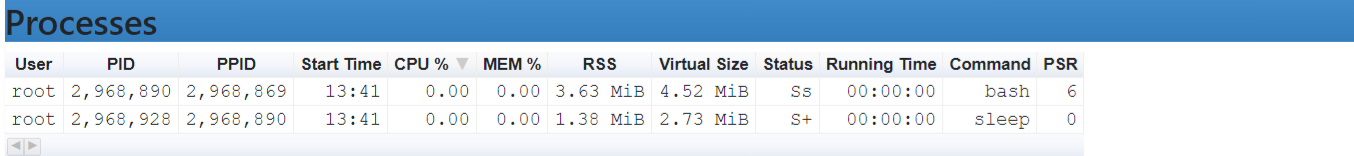
Figure 5. Output of “ps” command in the Docker container as seen on the web UI
Additionally, while examining the web UI, we found that it exposes the list of all container images on the host, regardless of whether the container based on the image is running or stopped. This finding is particularly interesting as the container image list cannot be obtained from the REST API, nor is it visible from the web UI unless a user manually inspects the web resources:
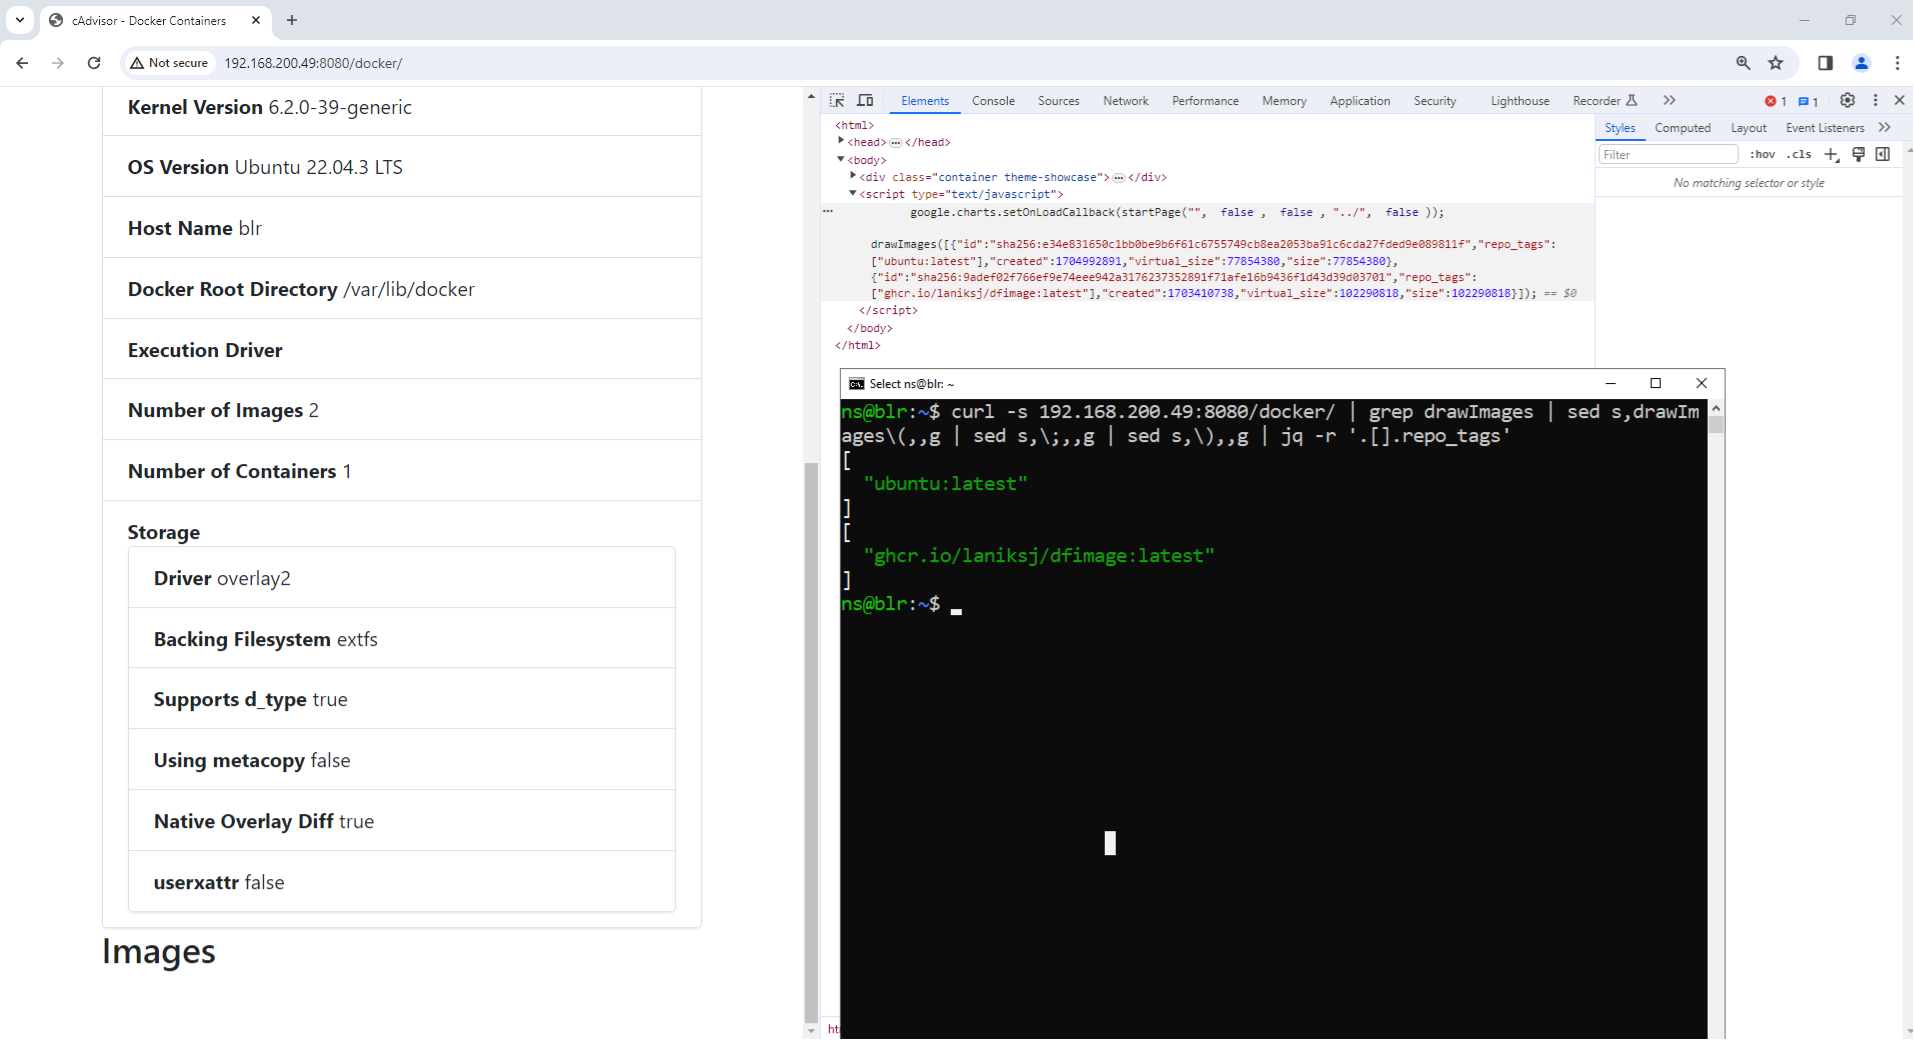
Figure 6. Fetching all container image names using the web UI
REST APIs
The web UI uses REST APIs to fetch information. These APIs are documented on cAdvisor’s GitHub repositories (cAdvisor Remote REST API versions 1 and 2). Using the REST API, one can fetch the following information regarding the host:
- Number of cores
- RAM capacity
- Storage capacity
- Kernel version
- Operating system version
- Docker version
- Container names
- Network and disk I/O
- Cloud provider
- Output of “ps” command for each cgroup
- List of all cgroups under each service monitored by system
From an attacker’s perspective, these pieces of information can be used to perform reconnaissance on a target to gauge whether the target is of interest or otherwise.
Environment variables in “/metrics”
From the various runtime options that one can use with cAdvisor, we noticed a flag named
--env_metadata_whitelist:
--env_metadata_whitelist: is a comma-separated list of environment variable keys that need to be collected for containers. Currently, this list only supports containerd and Docker runtimes.
Using this flag, one can monitor environment variables from Docker containers, including metrics, as Figure 7 shows:
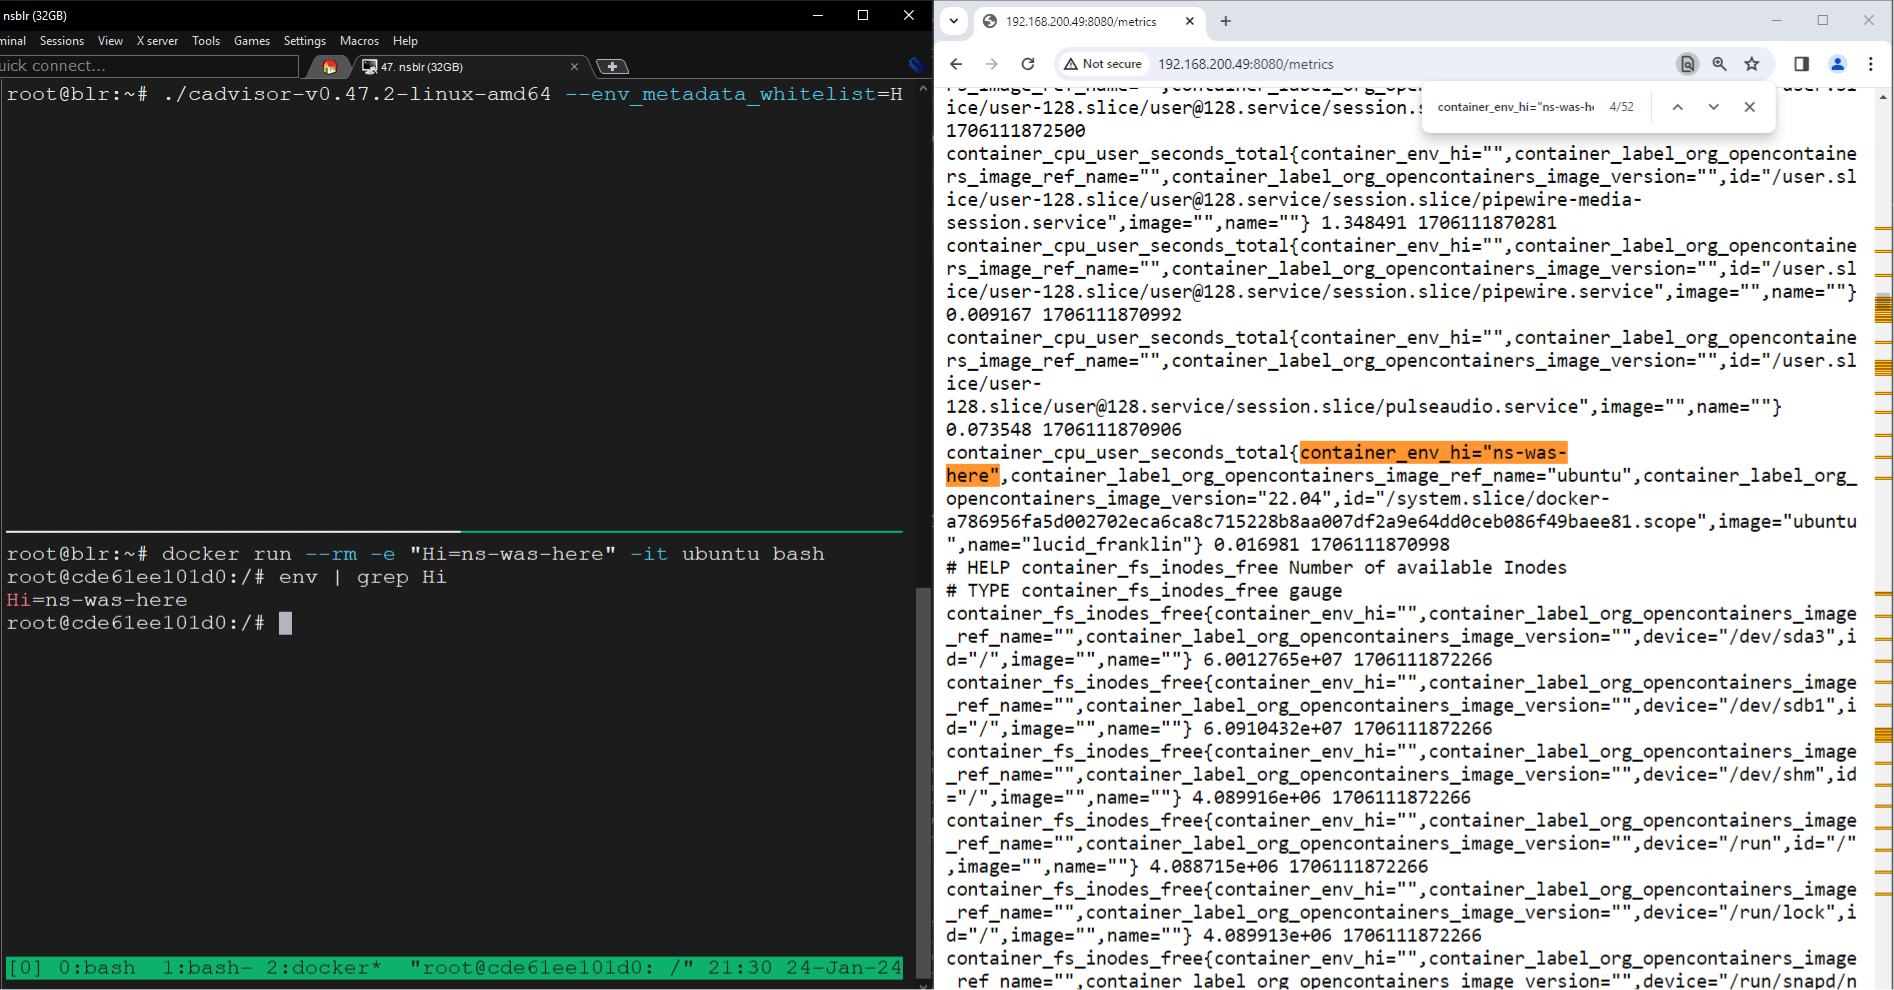
Figure 7. Environment variable named “Hi” being logged as a metric in the “/metrics” endpoint
The label name for environment variables being logged as metrics begins with container_env_. For example, in our case, since the environment variable is named “Hi”, the label to look out for is container_env_hi.
Observe the value of the flag in the command line. Based on the command-line argument and the description, the environment variable named “H” should have been logged. However, we observed that environment variables beginning with the letter “H” (ignoring the case) were getting logged.
Hence, the flag --env_metadata_whitelist would log any environment variable with the prefix supplied in the value of the flag. Let’s say a user wanted to log an environment variable named “AWS”. However, because of the implementation of logging environment variables as metrics in cAdvisor, environment variables having the prefix “AWS” would get logged. You can try creating your own environment using the Docker Compose YAML shared here. Upon tracing how the flag is parsed and used, we came across a comment that mentions the environment variables are prefix-based:
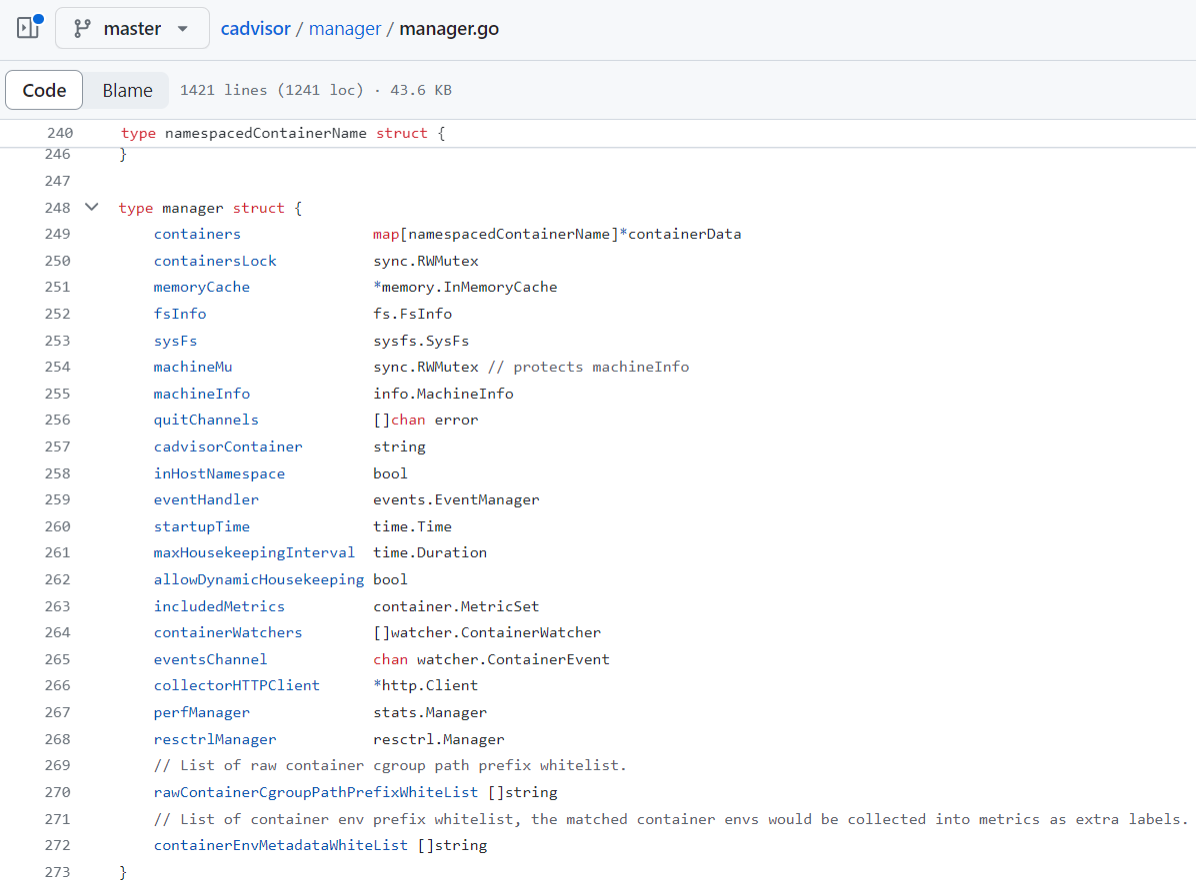
Figure 8. Comments in source code (L#271) mentioning a prefix-based allowlist for environment variables
So far, we have observed the following:
- There is a feature to log environment variables in the metrics endpoint.
- A discrepancy in the REST API and web UI leads to the exposure of all container image names on the host, regardless of whether the created container even exists.
- Various pieces of information about the host and running containers can be seen.
Additionally, one can only set up HTTP basic or digest-based authentication on the web UI — meaning the REST API and metrics endpoint would be exposed without any authentication in a default configuration.
Given the amount of information exposed in default and specific configurations, we were interested in performing non-intrusive scans in real-world deployments to validate whether the public exposure of cAdvisor was problematic or otherwise. As with insecure defaults, we found the exposure of sensitive information, which we detail in the succeeding section.
In-the-wild cAdvisor exposure
Since we’re interested in exposed cAdvisor instances, we narrowed down our results based on the exposure of the web UI. The title of the web page, “cAdvisor - /”, can be used to look for exposed cAdvisor instances, and we crafted queries to search across search engines such as Shodan.
Cloud provider
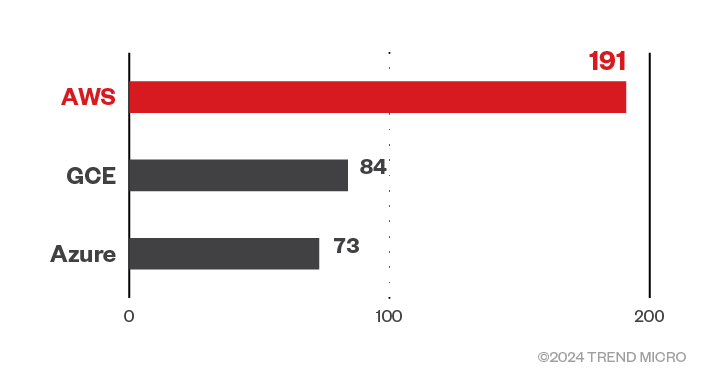
Figure 9. cAdvisor exposure across AWS, Azure, and GCE
cAdvisor REST APIs expose the cloud provider on which cAdvisor is being run. Currently, AWS, Azure, and GCE are supported. This information is fetched from the following files:
- /sys/class/dmi/id/bios_vendor
- /sys/class/dmi/id/product_version
- /sys/class/dmi/id/product_uuid
- /sys/class/dmi/id/sys_vendor
- /sys/class/dmi/id/product_name
- /etc/os-release
Additionally, for AWS and GCE, the instance IDs are fetched by querying the instance metadata service. However, for Azure, the instance ID is fetched from the file /sys/class/dmi/id/product_uuid. Going by Shodan data, the exposure was spread across these cloud platforms:
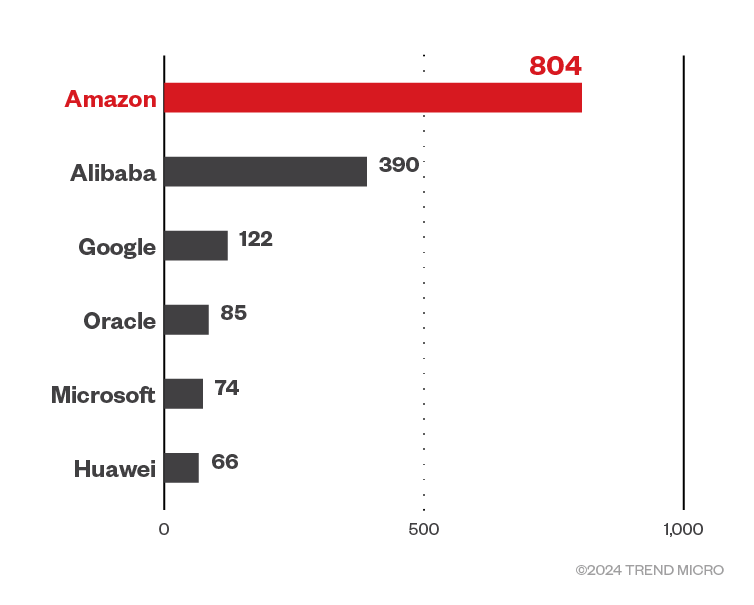
Figure 10. cAdvisor exposure across public cloud service providers
cAdvisor versions
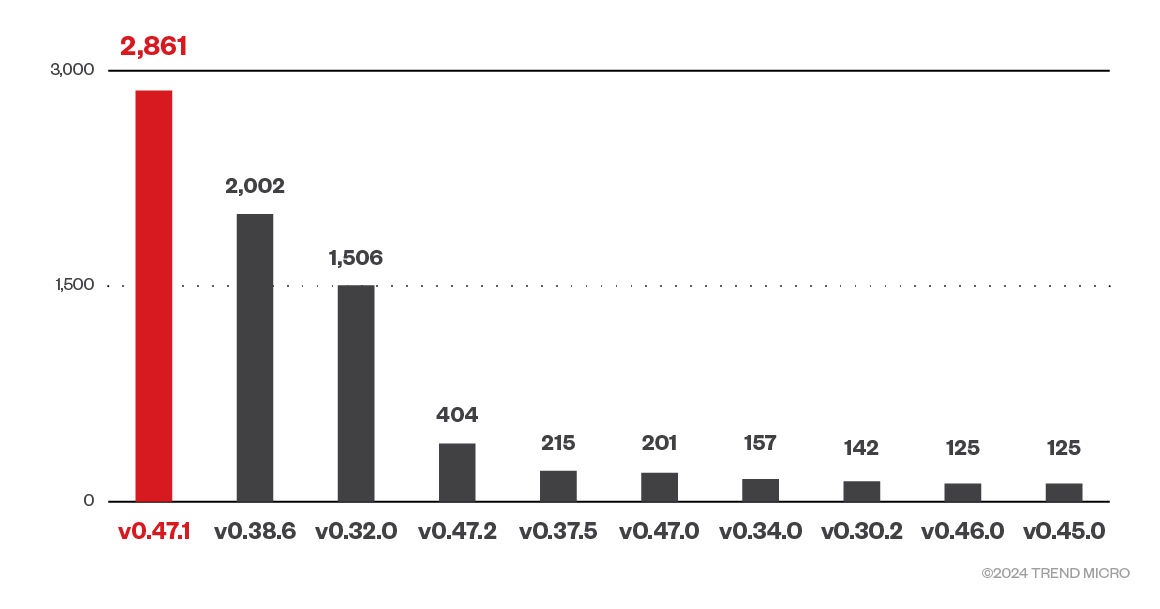
Figure 11. Top 10 versions of exposed cAdvisor instances
Number of cores
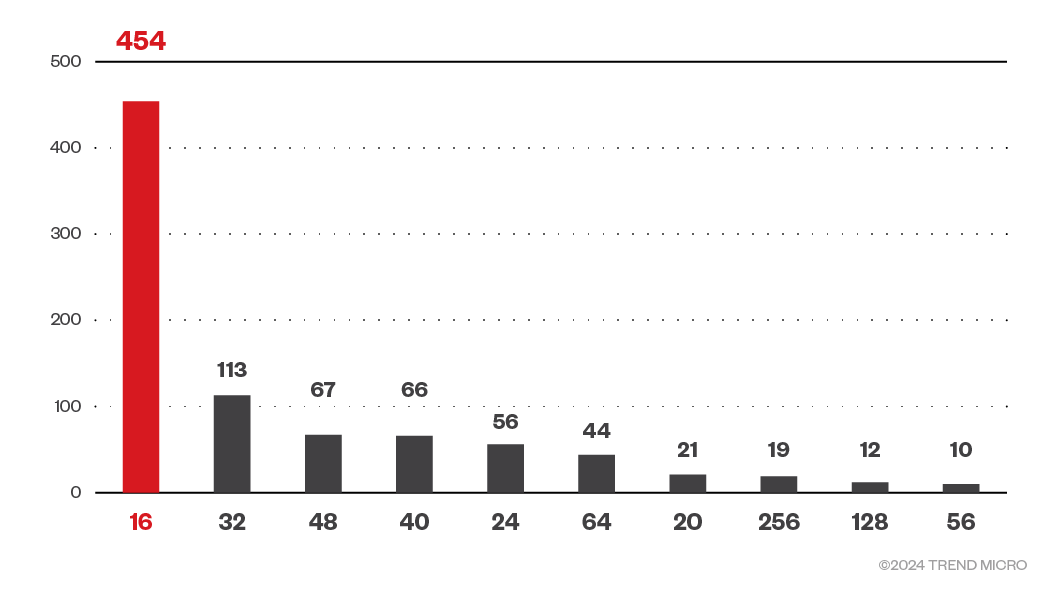
Figure 12. Number of cores (>12) of exposed cAdvisor instances
Memory capacity
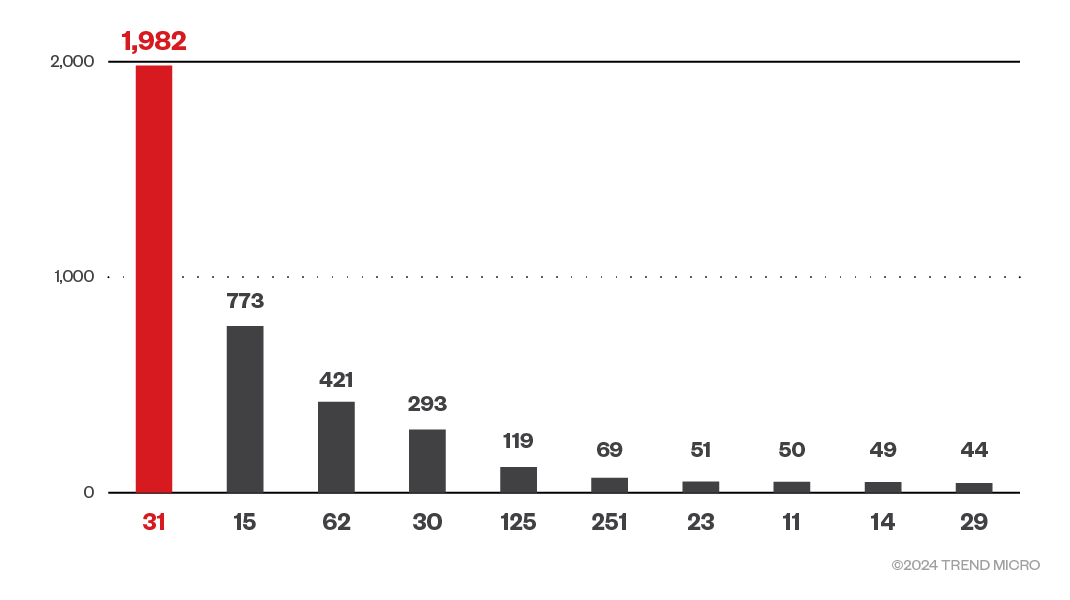
Figure 13. Memory capacity (>8GB) of exposed cAdvisor instances
We came across instances where the RAM capacity ranged up to 251 GB. From the looks of it, these instances are likely to be production-grade systems that had their cAdvisor instance publicly exposed. While checking for instances where the number of cores is greater than 12, we saw a few instances with over 200 cores. Given how attackers were previously focused on cryptocurrency mining, we can infer that some powerful machines have had their instance of cAdvisor exposed, making the targets quite lucrative.
Exposed environment variables as metrics
From the "/metrics" endpoint, we found instances where the following environment variables were being logged and exposed.
- AWS Access Key ID and Secret Access Key
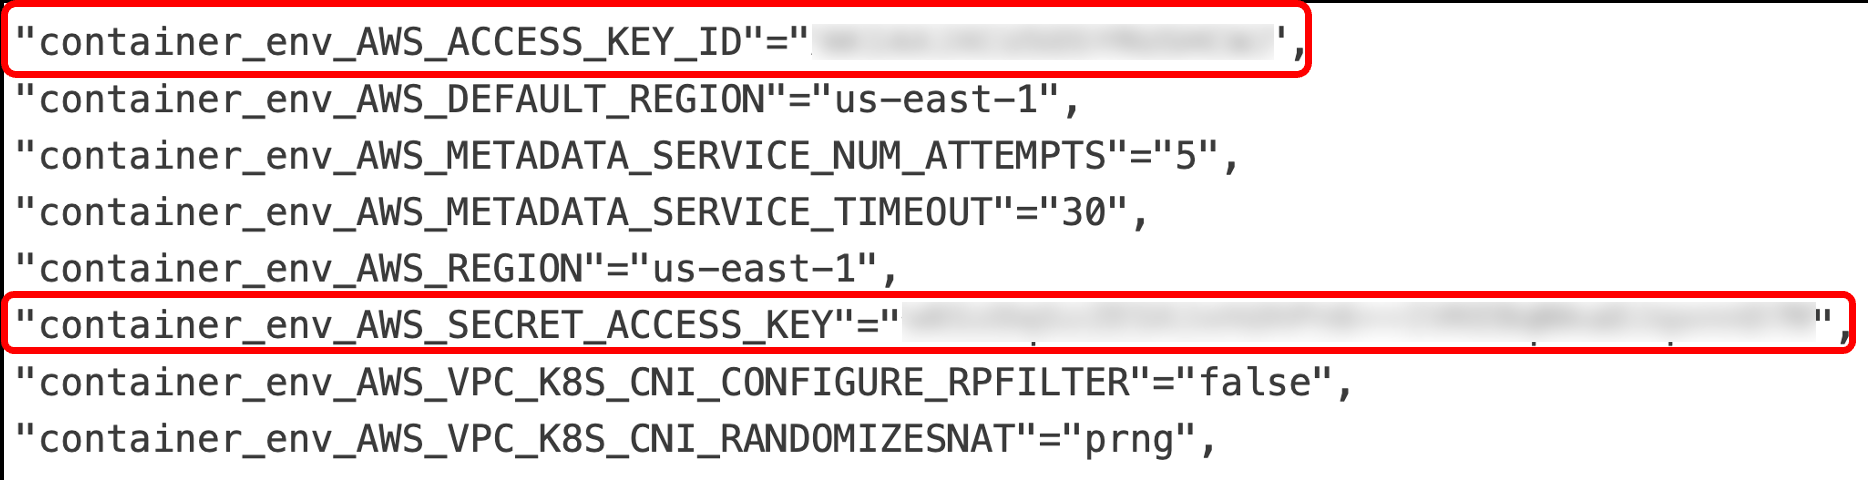
Figure 14. AWS Access Key ID and Secret Access Key logged as metrics
- Amazon Relational Database Service (RDS) credentials

Figure 15. An AWS RDS endpoint with username and password in clear text
- Redis credentials
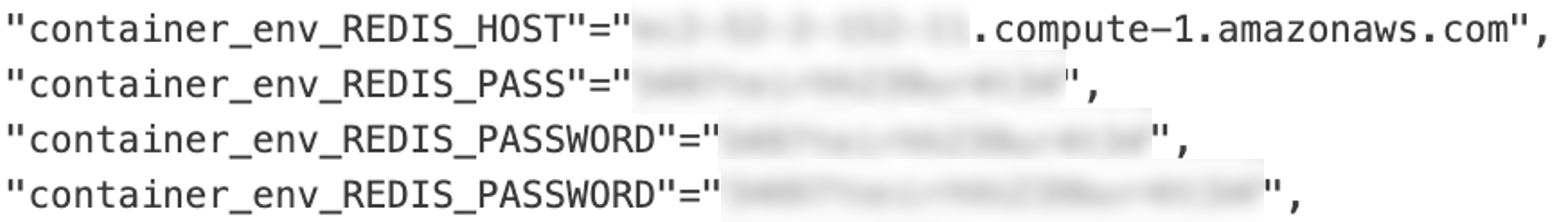
Figure 16. Redis credentials
- API keys
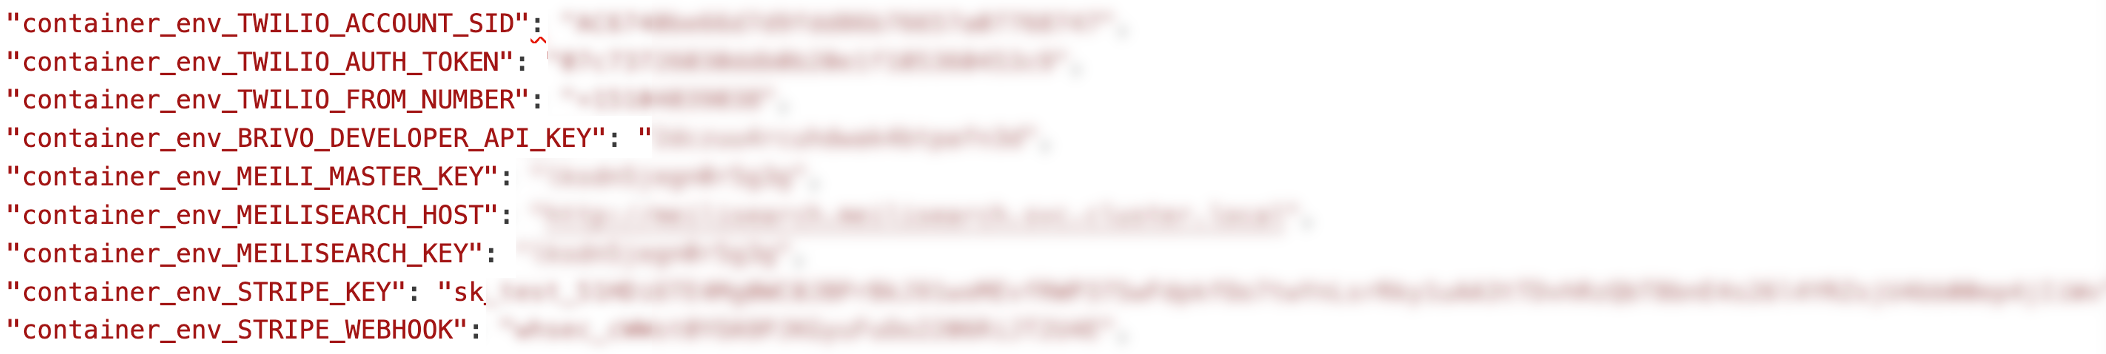
Figure 17. API keys of applications such as Twilio, Stripe, Brivo, and Meilisearch
- Azure service principal secrets

Figure 18. Azure service principal credentials
Environment variables are widely used to propagate secrets in applications and are often considered safer compared to storing credentials in files. However, when there are other components being used — such as cAdvisor, which has powerful logging environment variables features — the risk increases. Environment variables are often initialized once a container starts, like what we saw in the aforementioned demo. We previously discussed the various pitfalls and risks one needs to be aware of when using environment variables for storing credentials.
Impact
Assessing the risks of such exposures, remote unauthenticated attackers could perform the following actions:
- Reconnaissance. Information disclosure of underlying host operating system, kernel version, memory capacity, storage capacity, Docker and cAdvisor versions, running processes (output of “ps” command), cloud provider (AWS, GCP, Azure), number of cores, running services, and network and disk I/O could equip attackers to better understand the environment and gauge whether the target is valuable or otherwise and plan their attacks accordingly.
- Lateral movement and privilege escalation via metrics leaking environment variables. If the users used the flag to log environment variables as metrics, these metrics could possibly leak environment variables containing sensitive information such as AWS credentials, Postgres/MySQL/Grafana admin passwords, and API keys (as we observed in the wild). These could be used to gain initial access, move laterally within the environment post-compromise, and escalate privileges.
- Supply-chain compromise via misconfigured container registries. Because unauthenticated remote attackers could view the list of all container images on the host, they could also probe publicly reachable container registries. If these container registries are misconfigured (allow anonymous pulls, have misconfigured ECR repositories, and have weak credentials), the supply chain, beginning from the container image to the deployed application, could be adversely affected.
- Vulnerability exploitation via container images. If attackers can figure out exploitable features or vulnerabilities (known or unknown) in the container images being used, they could potentially craft exploits and perform successful attacks, ranging from initial access to lateral movement and privilege escalation.
Disclosure timeline
Upon confirming the public exposure in an unsecure default configuration, we shared our findings with Google via the Zero Day Initiative (ZDI), with the exposure being tracked as ZDI-24-369. On Jan. 31, 2024, Google explicitly mentioned this in its cAdvisor GitHub documentation:
NOTE: The Web UI authentication only protects the `/containers` endpoint, and not the other cAdvisor HTTP endpoints such as `/api/...` and `/metrics`. Some of these endpoints can expose sensitive information, so it is not advised to expose these endpoints publicly.
Security measures
To keep cAdvisor instances secure, we recommend implementing the following security measures:
- To proactively reduce the attack surface, cAdvisor recommends that teams apply the following flags:
- Enable HTTP basic or digest-based authentication on the Web UI (--http_auth_file,
--http_auth_realm, --http_digest_file, and --http_digest_realm). - Disable metrics that are not required (--disable_metrics).
- Change the default port from 8080 to a custom port (--port).
- Use a custom metrics endpoint (--prometheus_endpoint).
- Enable HTTP basic or digest-based authentication on the Web UI (--http_auth_file,
- Unless exposing metrics over the internet is already considered and accounted for in your threat model, do not expose metrics to the public. Protecting the metrics endpoint is as important as protecting Prometheus dashboards and keeping your on-premise and cloud native environments safeguarded from such exposures.
- To proactively reduce the attack surface, cAdvisor recommends that teams apply the following flags:
Like it? Add this infographic to your site:
1. Click on the box below. 2. Press Ctrl+A to select all. 3. Press Ctrl+C to copy. 4. Paste the code into your page (Ctrl+V).
Image will appear the same size as you see above.
- Cracking the Isolation: Novel Docker Desktop VM Escape Techniques Under WSL2
- Azure Control Plane Threat Detection With TrendAI Vision One™
- Forecasting Future Outbreaks: A Behavioral and Predictive Approach to Proactive Cyber Risk Management
- Fault Lines in the AI Ecosystem: TrendAI™ State of AI Security Report
- The Industrialization of Botnets: Automation and Scale as a New Threat Infrastructure
 Fault Lines in the AI Ecosystem: TrendAI™ State of AI Security Report
 Cracking the Isolation: Novel Docker Desktop VM Escape Techniques Under WSL2
 Ransomware Spotlight: DragonForce
 Stay Ahead of AI Threats: Secure LLM Applications With Trend Vision One